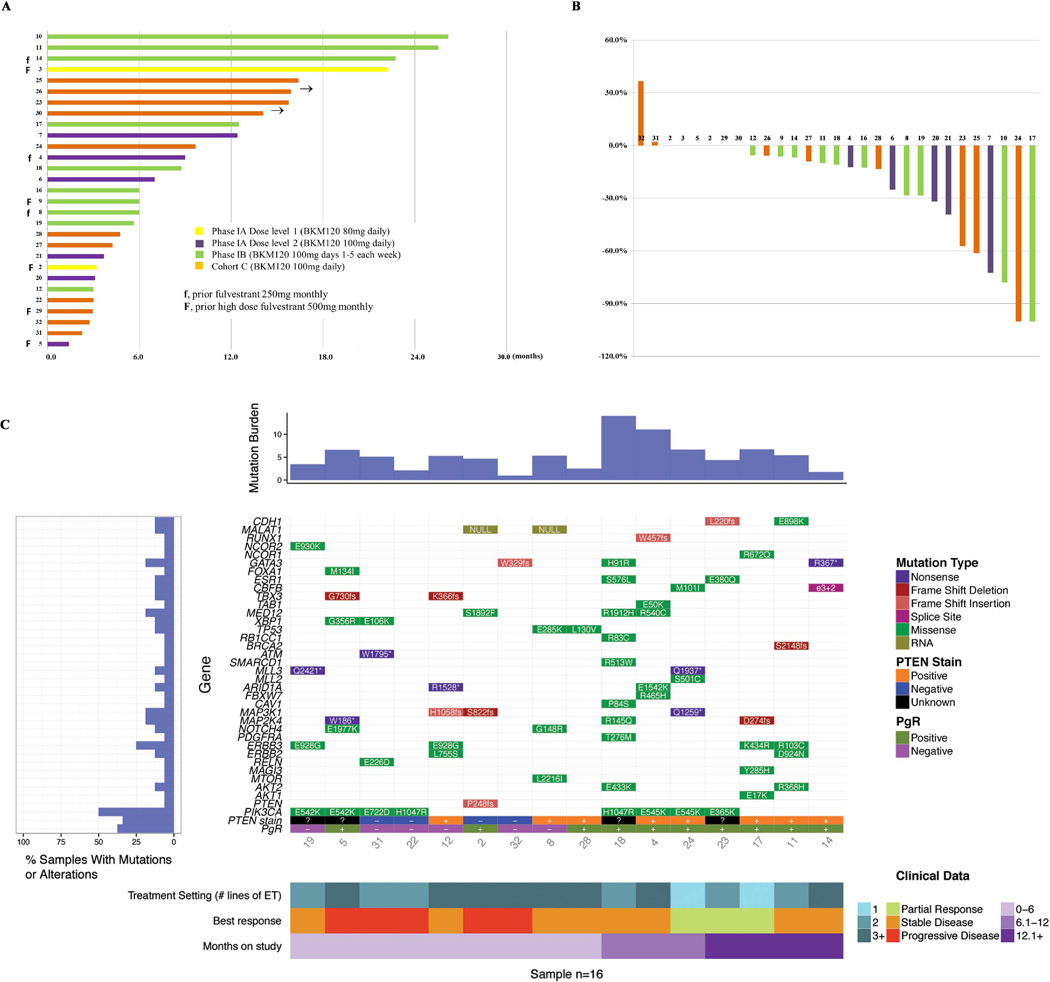
Fig. 2. Anti-tumor activity.
A. Duration on study B. Percentage change in target lesion at best response compared to baseline C. Mutation landscape, PTEN status by IHC, and treatment setting based on lines of endocrine therapy in relation to tumor response and duration on therapy
Mutation burden (number of genes with mutations identified), genes and mutation type, PTEN IHC results, PgR of metastatic site, clinical response and duration on therapy are annotated for each patient. % of samples (patients) with mutations in specific genes are also presented on the left panel of Fig. 2C.

