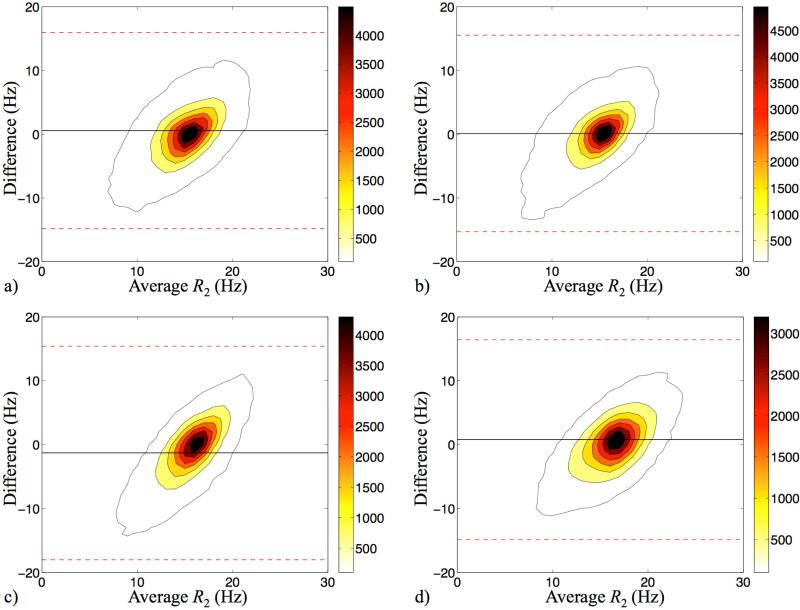
Fig. 8.
Contoured Bland-Altman plots compared the R2 results from spin-echo experiments and our DESS approach, for Subjects F-I (a-d). The outmost contours represent the sample density of 100 counts/Hz2. Black solid lines show the mean difference of the two measurements, and the red dashed lines represent the 95% limits of agreement. The averaged R2 difference was 0.034 Hz.

