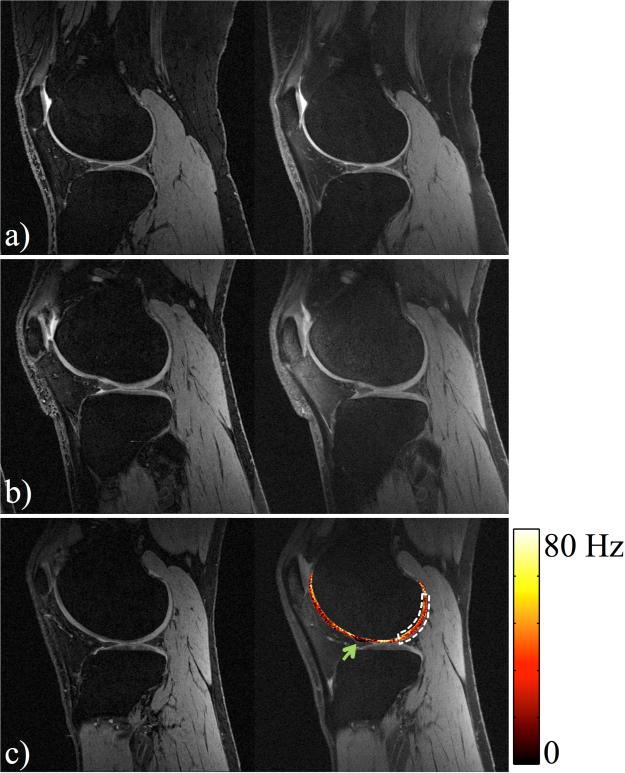
Fig. 9.
Reference DESS (left) and synthetic DESS images (right) for Subjects J-L. Similar image contrast was achieved in both cases, and led to similar measurements of cartilage volume (average difference: −4.93%). R2 information was displayed as an overlay in (c). The dark red region as marked with the green arrow, where R2 values were very small, may indicate the presence of joint fluid. An average T2 of 33.8 ms was calculated over the indicated ROI (white dashed region).

