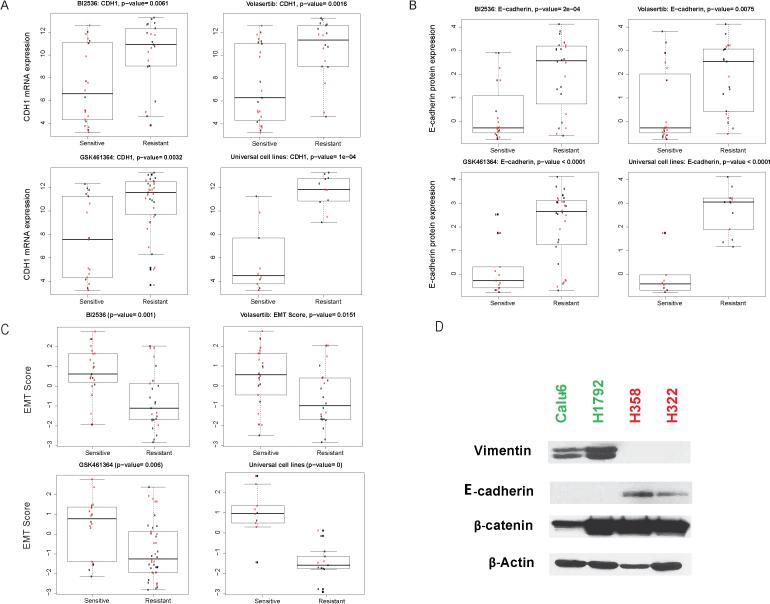
Figure 4.
NSCLC cell lines with mesenchymal gene expression patterns are more sensitive to PLK1 inhibition than are those with epithelial gene expression patterns. E-cadherin mRNA (CDH1; A) and protein (B) expression levels were significantly higher in PLK1 inhibition-resistant cell lines than in sensitive ones. C, EMT scores for PLK1 inhibition-sensitive and -resistant cell lines determined using a published signature (17). Data on KRAS-mutant cell lines are shown in red. D, E-cadherin and vimentin protein expression levels in 2 representative cell lines according to Western blotting. PLK1 inhibition-sensitive and -resistant cell lines are indicated in green and red, respectively.

