
Figure 5. MALAT1 knockdown affects RGC function upon oxidative stress in vitro .
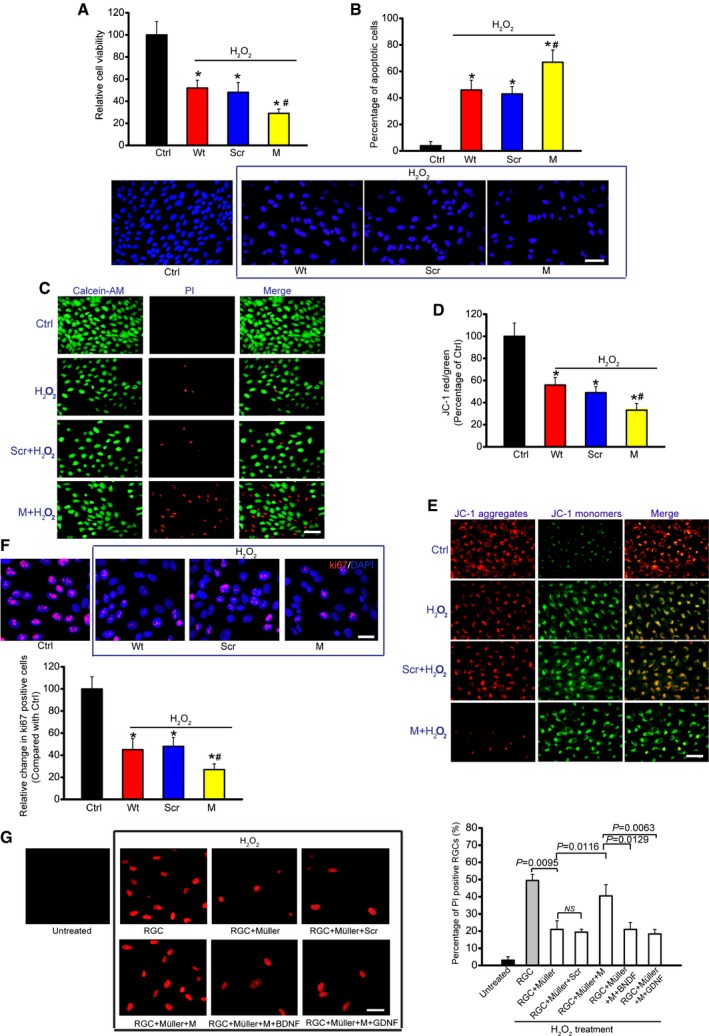
Primary RGCs were transfected with scrambled (Scr) shRNA, MALAT1 shRNA, or left untreated and then exposed to H2O2 (50 μm) for 48 h. The group without any treatment was taken as the control (Ctrl) group.
-
ACell viability was determined using MTT method [n = 5 independent experiments; analyzed by two‐sided Student's t‐test; *P = 0.0285 (Wt), *P = 0.0246 (Scr), *P = 0.0132 (M), # P = 0.0311].
-
BApoptotic cells were analyzed using Hoechst staining and quantitated [n = 5 independent experiments; analyzed by two‐sided Student's t‐test; *P = 0.0211 (Wt), *P = 0.0283 (Scr), *P = 0.0076 (M), # P = 0.0289]. Scale bar, 50 μm.
-
CDead or dying cells were analyzed using calcein‐AM/PI staining from three independent experiments. Green, live cells; red, dead, or dying cell. Scale bar, 50 μm.
-
D, EPrimary RGCs were incubated with JC‐1 probe at 37°C for 30 min, centrifuged, washed, transferred to a 96‐well plate, and assayed using a fluorescence plate reader [n = 5 independent experiments; analyzed by two‐sided Student's t‐test; *P = 0.0212 (Wt), *P = 0.0299 (Scr), *P = 0.0147 (M), # P = 0.0349], and observed using a fluorescence microscope. Red fluorescence, JC‐1 aggregates; green fluorescence, JC‐1 monomers (E). Scale bar, 50 μm.
-
FKi67 staining and quantitative analysis was performed to detect RGC proliferation [n = 5 independent experiments; analyzed by two‐sided Student's t‐test; *P = 0.0178 (Wt), *P = 0.0235 (Scr), *P = 0.0089 (M), # P = 0.0186]. Scale bar, 20 μm. DAPI, blue; Ki67, red.
-
GPrimary RGCs were co‐cultured with Müller cells. Müller cells were transfected with MALAT1 (M) siRNA or scrambled (Scr) siRNA and then treated with or without BDNF (1 μg/μl) or GDNF (1 μg/μl). After these treatments, the experimental groups were exposed to H2O2 (50 μm) for 48 h. PI staining and quantitative analysis was performed to detect the dead or dying RGCs (n = 5 independent experiments; analyzed by one‐way ANOVA with Bonferroni post hoc). Scale bar, 20 μm.