
Figure EV4. Area under the curve analysis of Morris water maze data.
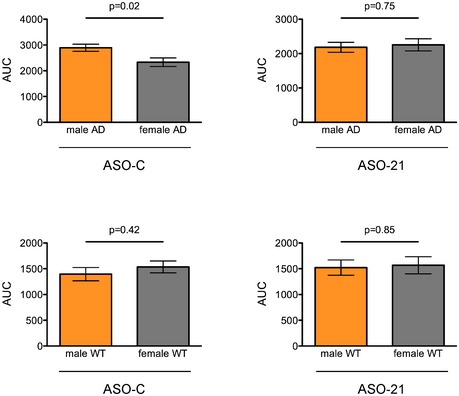
Morris water maze analysis integrated distance area under the curve (AUC) for male and female AD (top) and WT (bottom) mice treated with control ASO (left) or ASO‐21 (right)(mean ± s.e.m.; Student's t‐test). Mice are the same as those analyzed in Fig 6.