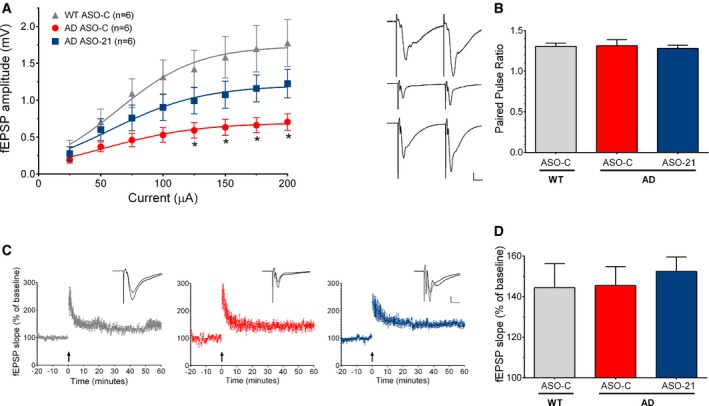
Input–output curves show hippocampal CA1 field excitatory postsynaptic potential (fEPSP) response amplitudes as a function of stimulus intensity delivered to Schaffer collateral afferent fibers. Two‐way repeated‐measures ANOVA revealed a significant effect of treatment (F
(2,119) = 31.62, P < 0.0001) with the Bonferroni multiple comparison test showing significant differences between ASO‐C‐treated AD and age‐matched ASO‐C‐treated WT (*P < 0.05). Responses from ASO‐21‐treated AD mice were not significantly different from ASO‐C‐treated WT or AD mice.
Representative paired‐pulse facilitation (PPF) responses from ASO‐C‐treated WT (top), ASO‐C‐treated AD (middle), and ASO‐21‐treated AD (bottom) mice are shown to the left. Scale bars = 0.2 mV by 10 ms apply to all traces. Bar graph (right) summarizes the paired‐pulse ratios. PPF was not significantly different in AD compared to WT samples, nor was it affected by ASO‐21 treatment.
LTP was unaffected after ASO‐21 treatment and similar in AD compared to WT mice. To combine data from multiple slices, individually measured fEPSP rise slopes were normalized to the average baseline value taken 0–10 min before tetanic stimulation (arrows). The normalized values are plotted as a function of time for ASO‐C‐treated WT (gray, left), ASO‐C‐treated AD (red, middle), and ASO‐21‐treated AD mice (blue, right). Representative traces taken before and 50‐60 min after tetanic stimulation are shown in the insets (scale bars = 0.2 mV by 10 ms for all traces).
Graph summarizes LTP results as the ratio of mean fEPSP rise slope measured 50–60 min after tetanic stimulation divided by that taken 0–10 min before tetanic stimulation. There was no significant difference among groups. Data information: All data are shown as mean ± s.e.m. and are from the same hippocampal brain slices (n = 6 slices from 4, 3, and 4 WT/ASO‐C, AD/ASO‐C, and AD/ASO‐21 animals per group, respectively).