
Figure 3. uORFs and oORFs regulate translation in mammals.
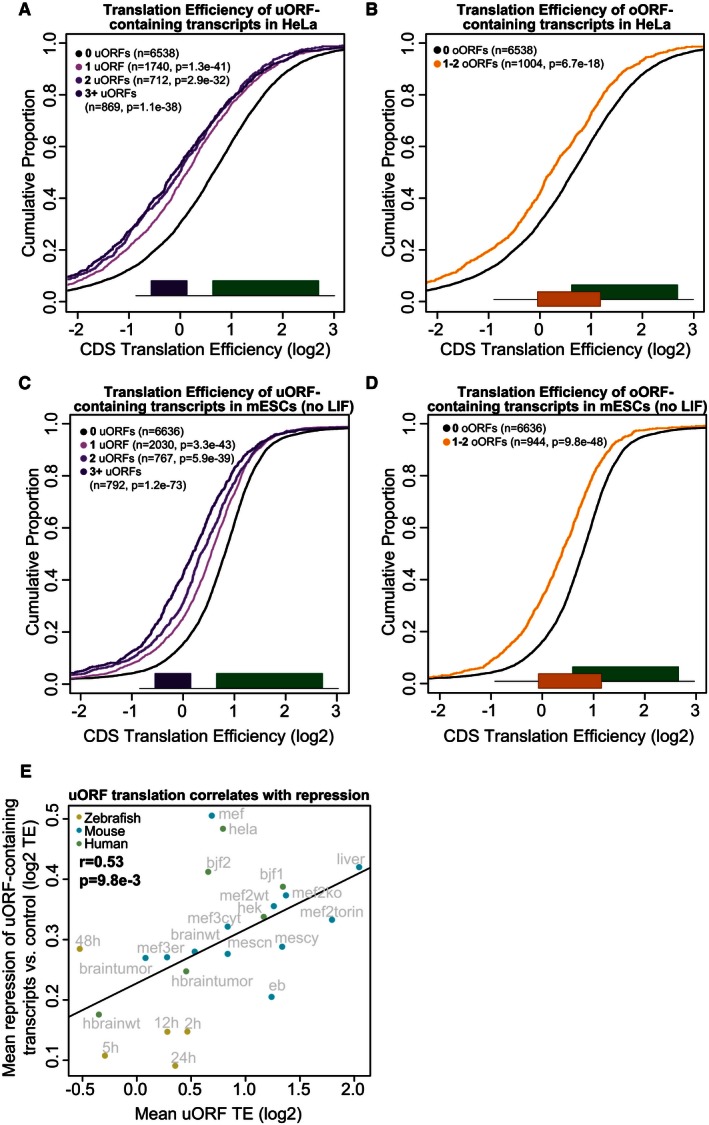
- uORF‐containing transcripts are repressed in HeLa cells. Plot displays the cumulative distribution of translation efficiency in expressed (> 0.5 RPKM) transcripts containing 1, 2, or > 2 uORFs versus transcripts lacking uORFs. Transcripts containing oORFs are excluded from this set. Two‐sided Wilcoxon P‐values are provided for each uORF set compared to the control.
- oORF‐containing transcripts are repressed in HeLa cells. Plot displays the cumulative distribution of translation efficiency in expressed (> 0.5 RPKM) oORF‐containing transcripts versus transcripts lacking oORFs. Transcripts containing uORFs are excluded from this set. Two‐sided Wilcoxon P‐value is provided for the oORF set compared to the control.
- uORF‐containing transcripts are repressed in murine embryonic stem cells. Plot displays the cumulative distribution of translation efficiency in expressed (> 0.5 RPKM) transcripts containing 1, 2, or > 2 uORFs versus transcripts lacking uORFs. Transcripts containing oORFs are excluded from this set. Two‐sided Wilcoxon P‐values are provided for each uORF set compared to the control.
- oORF‐containing transcripts are repressed in murine embryonic stem cells. Plot displays the cumulative distribution of translation efficiency in expressed (> 0.5 RPKM) oORF‐containing transcripts versus transcripts lacking oORFs. Transcripts containing uORFs are excluded from this set. Two‐sided Wilcoxon P‐value is provided for the oORF set compared to the control.
- uORF translation is correlated with CDS repression. Scatterplot displays the per‐sample mean repression of uORF‐containing transcripts versus the mean translation efficiency of uORFs in single‐uORF transcripts. Repression is determined by calculating the difference between the mean TE of CDSs in uORF‐containing transcripts versus the mean TE of CDSs in transcripts lacking uORFs/oORFs in their TLS. Only expressed transcripts (> 0.5 RNA RPKM across samples per organism) were counted. Labels indicate the sample name. For more information on individual samples, see Table EV3.