-
A
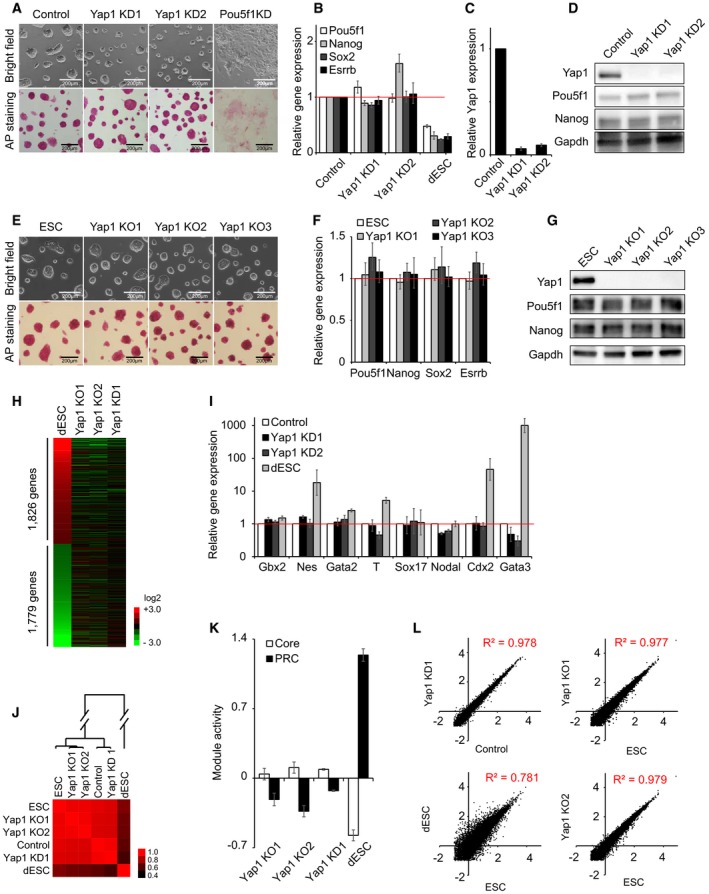
Colony morphology and alkaline phosphatase (AP) activity of ES cells upon KD of Yap1 and Pou5f1. KD1 and KD2 indicate two different shRNA sequences tested. All the following cell morphology and AP staining pictures were taken two passages (4 days) after lentivirus infection unless otherwise stated.
-
B, C
mRNA expression levels of Pou5f1, Nanog, Sox2, Esrrb (B), and Yap1 (C) upon KD of Yap1. All the following mRNA samples were harvested 4 days after lentivirus infection while passaged every 2 days unless otherwise stated. Data are represented as mean ± SD.
-
D
Protein levels of Yap1, Pou5f1, and Nanog upon KD of Yap1. All the following protein samples were harvested 4 days after lentivirus infection while passaged every 2 days unless otherwise stated.
-
E
Colony morphology and AP activity of mouse embryonic stem cells (ESC) and three Yap1 KO clones (KO1‐KO3).
-
F
mRNA levels of Pou5f1, Nanog, Sox2, and Esrrb upon KO of Yap1. Data are represented as mean ± SD.
-
G
Protein levels of Yap1, Pou5f1, and Nanog in Yap1 KO clones.
-
H
A heatmap showing relative mRNA expression levels of 3,605 genes differentially expressed (> twofold) between ES cells and differentiating ES cells (dESC). Genes were sorted by the fold changes of gene expression between dESC and ES cells. Corresponding gene expression profiles obtained from Yap1 KO1, Yap1 KO2, and Yap1 KD cells are also shown.
-
I
mRNA expression levels of lineage‐specific marker genes upon KD of Yap1. dESC were used as control cells.
-
J
A heatmap showing Pearson's correlation coefficients of gene expression profiles obtained from ESC, control virus‐infected ES cells (Control), dESC, Yap1 KD cells, and Yap1 KO cells.
-
K
Relative average module activities (Core and PRC) in Yap1 KD1 cells, KO cells, and dESC. Module activities were normalized by the data obtained in ES cells. Data are represented as mean ± SEM.
-
L
Scatter plots showing log10 (FPKM) values of genes in Yap1 KD1 cells and Control (upper left panel), dESC and ESC (bottom left panel), and Yap1 KO cells and ES cells (right two panels). Pearson's correlation coefficients (R
2) are indicated. “FPKM” indicates fragments per kilobase of transcript per million fragments mapped.

