-
A–C
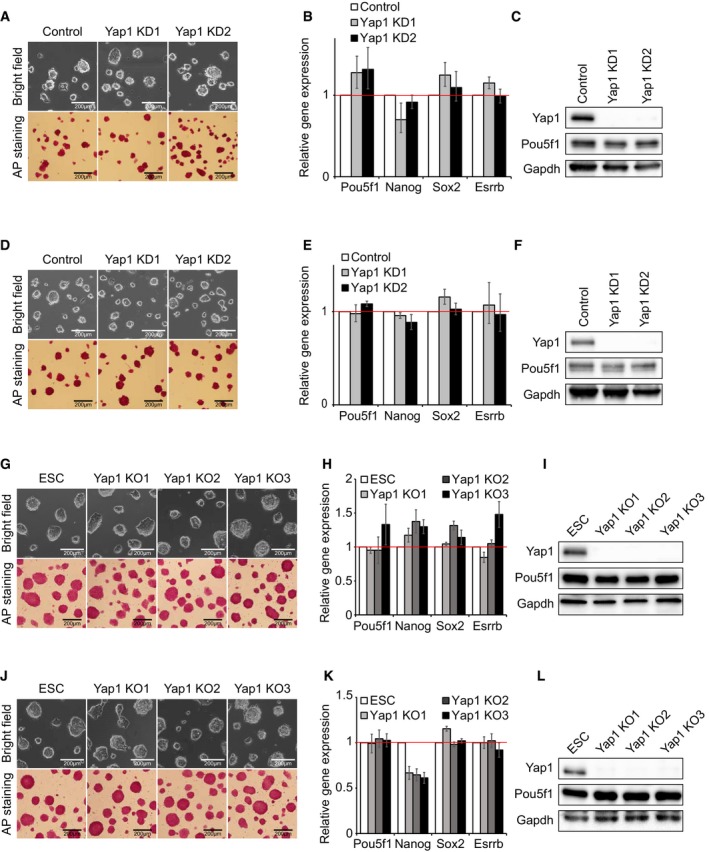
Data from CJ7 ES cells. Colony morphology and AP activity of Yap1 KD cells (A), mRNA levels of Pou5f1, Nanog, Sox2, and Esrrb in Yap1 KD cells (B), and protein expression levels of Yap1, Pou5f1, and Gapdh were measured in Yap1 KD cells (C). mRNA level data are represented as mean ± SD.
-
D–F
Data from E14 ES cells. Colony morphology and AP activity of Yap1 KD cells (D), mRNA levels of Pou5f1, Nanog, Sox2, and Esrrb in Yap1 KD cells (E), and protein expression levels of Yap1, Pou5f1, and Gapdh were measured in Yap1 KD cells (F). mRNA level data are represented as mean ± SD.
-
G–I
Data from CJ7 ES cells (ESC). Colony morphology and AP activity of Yap1 KO clones (G), mRNA levels of Pou5f1, Nanog, Sox2, and Esrrb in Yap1 KO clones (H), and protein expression levels of Yap1, Pou5f1, and Gapdh were measured in Yap1 KO clones (I). mRNA level data are represented as mean ± SD.
-
J–L
Data from E14 ES cells. Colony morphology and AP activity of Yap1 KO clones (J), mRNA levels of Pou5f1, Nanog, Sox2, and Esrrb in Yap1 KO clones (K), and protein expression levels of Yap1, Pou5f1, and Gapdh were measured in Yap1 KO clones (L). mRNA level data are represented as mean ± SD.

