-
A
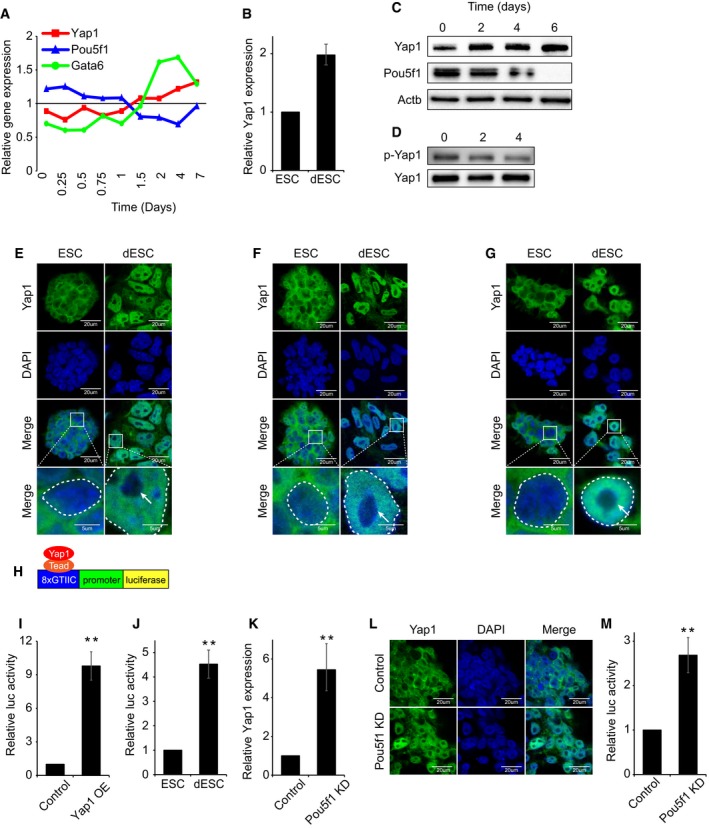
Relative mRNA levels of Yap1, Pou5f1, and Gata6 during time‐course embryoid body (EB) differentiation. Gene expression data were obtained from GSE3749. Pou5f1 and Gata6 serve as representative ES cell marker and lineage‐specific marker, respectively.
-
B
Relative Yap1 mRNA levels in ES cells (ESC) and differentiating ES cells (dESC) (LIF withdrawal for 4 days) and data are represented as mean ± SD. To differentiate ES cells, cells were incubated in LIF‐withdrawn medium for 4 days. Both ESC and dESC were passaged every 2 days.
-
C
Protein levels of Yap1 and Pou5f1 during time‐course differentiation upon LIF withdrawal.
-
D
Phospho‐Yap1 levels during time‐course differentiation. Samples were normalized by total Yap1 level.
-
E–G
Immunofluorescence (IF) images depicting localization of Yap1 in J1 (E), CJ7 (F), and E14 (G) mouse ESC (top) and dESC (bottom). The white arrow indicates nucleolus. Bottom panels represent higher magnification of the above panels. Dashed circle indicates nucleus border.
-
H
A schematic diagram depicting a Yap1‐responsive luciferase reporter (8xGTIIC) construct.
-
I
Luciferase reporter assay using Yap1‐responsive luciferase reporter (8xGTIIC) upon transient overexpression (OE) Yap1 in ES cells. P‐values were calculated using Student's t‐test. Data are represented as mean ± SD. **P < 0.01. “Control” indicates ES cells infected with control virus not expressing any specific shRNA sequence.
-
J
Relative activity of Yap1‐responsive luciferase reporter gene in ESC and dESC. P‐values were calculated using Student's t‐test. Data are represented as mean ± SD. **P < 0.01.
-
K
Relative Yap1 mRNA levels in Control and Pou5f1 KD ES cells. Data are represented as mean ± SD. **P < 0.01. “Control” indicates ES cells infected with control virus not expressing any specific shRNA sequence.
-
L
IF images depicting localization of Yap1 in Control and Pou5f1 KD ES cells.
-
M
Relative activity of Yap1‐responsive luciferase reporter gene upon Pou5f1 KD in ES cells. P‐values were calculated using Student's t‐test. Data are represented as mean ± SD. **P < 0.01.

