-
A
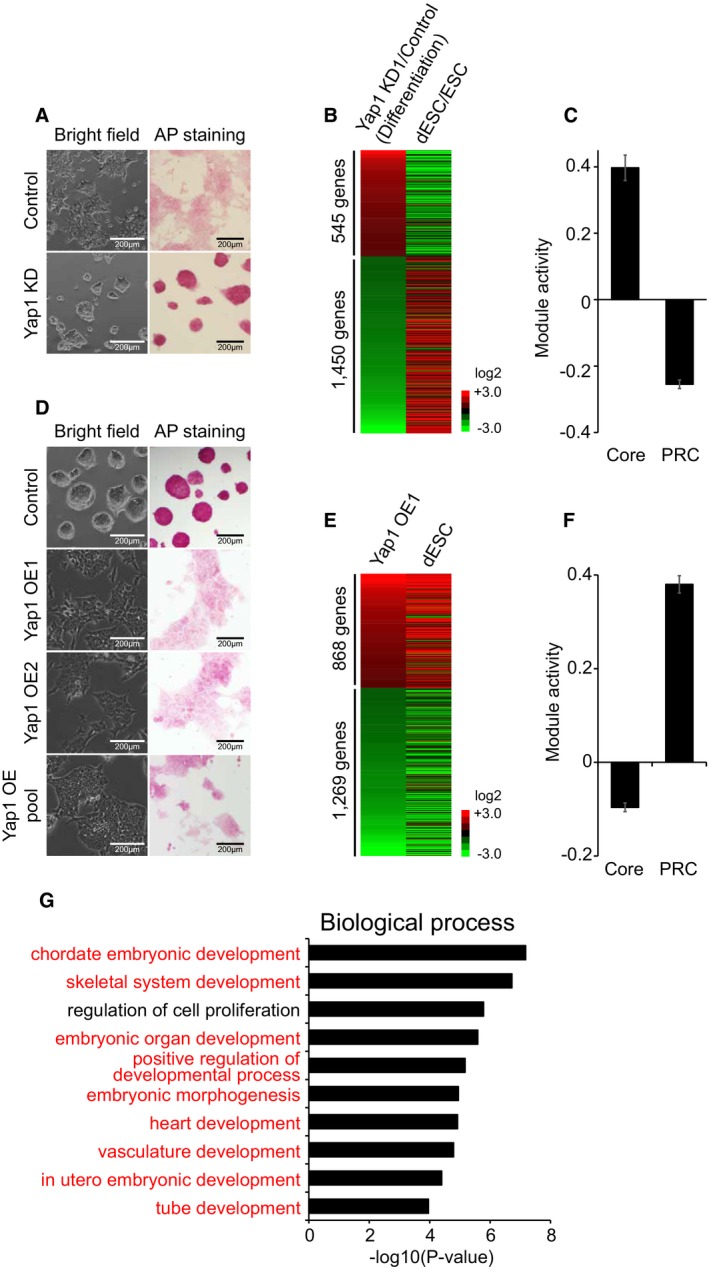
Colony morphology and AP activity of Control and Yap1 KD ES cells upon differentiation. Morphology and AP staining pictures were taken 2 days after differentiation.
-
B
A heatmap showing relative mRNA expression levels of 1,995 genes differentially expressed (> twofold) between Yap1 KD ES cells and Control upon 4 days of differentiation. Genes were sorted by the fold changes of gene expression between Yap1 KD ES cells and Control (first column). Corresponding gene expression changes between ES cells (ESC) and differentiating ES cells (dESC) are shown in the second column.
-
C
Relative average module activities (Core and PRC modules) between Yap1 KD ES cells and Control cells upon differentiation. Data are represented as mean ± SEM.
-
D
Colony morphology and AP activity in Yap1 OE cells. Two different Yap1 OE clones (OE1 and OE2) and pool of Yap1 OE (OE pool) were used. Cell morphology and AP staining pictures were taken 3 weeks after electroporation.
-
E
A heatmap showing relative mRNA expression levels of 2,137 genes differentially expressed (> twofold) between Yap1 OE ES cells and control ES cells. Genes were sorted by the fold changes of gene expression between Yap1 OE ES cells and control ES cells (first column) and corresponding gene expression profiles obtained from dESC are shown.
-
F
Relative average module activities (Core and PRC modules) between Yap1 OE cells and control cells are shown. Data are represented as mean ± SEM.
-
G
Genes up‐regulated in Yap1 OE cells were tested using David 6.7. Significantly enriched gene ontology (GO) terms (biological functions) are shown. Developmental process‐related GO terms are highlighted in red.

