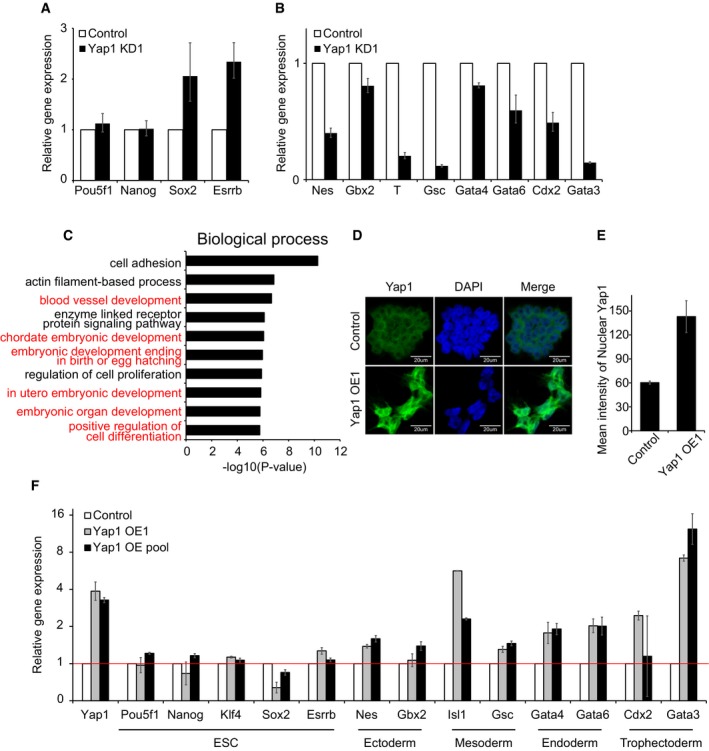
Figure EV6. Alteration of Yap1 affects differentiation of ES cells (related to Fig 4).

-
A, BmRNA levels of ES cell core factors (A) and lineage‐specific markers (B) in Yap1 KD1 cells upon 4 days of differentiation. White bars indicate the levels of genes tested in control virus‐infected ES cells (Control) upon differentiation. Data are represented as mean ± SD.
-
CBar graphs showing significantly enriched gene ontology (GO) terms (biological functions). GO analysis of genes down‐regulated in Yap1 KD cells upon differentiation was performed using David 6.7 tools. Developmental process‐related terms are highlighted in red.
-
DIF images showing localization of Yap1 in control and Yap1 OE cells.
-
EQuantification of nuclear Yap1 in control and Yap1 OE cells. Data are represented as mean ± SD.
-
FmRNA levels of ES cell (ESC) core factors and lineage‐specific marker genes in Yap1 OE cells and Yap1 OE pool. Data are represented as mean ± SD.
