
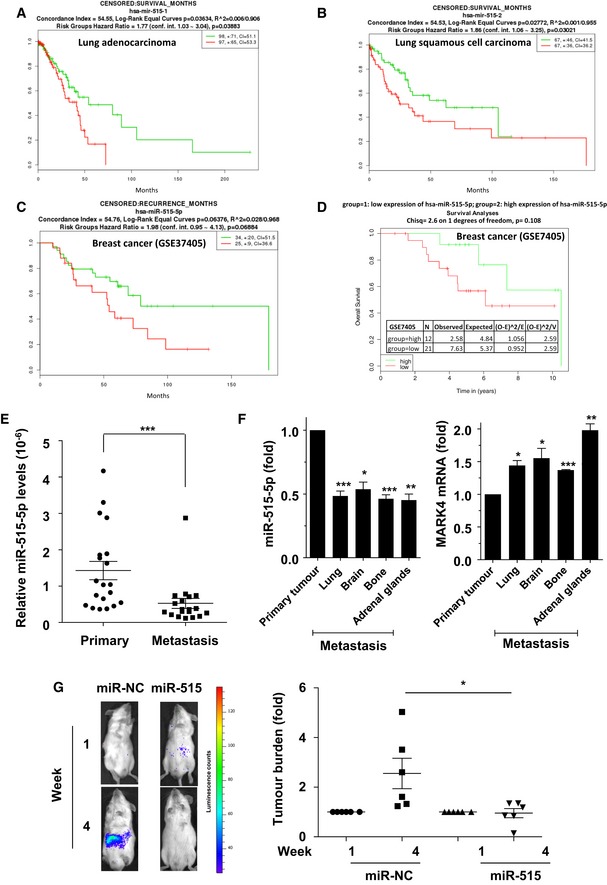
Figure 6. miR‐515‐5p expression is inversely correlated with breast cancer metastasis and correlates with good patient prognosis.
-
A–DLow expression of miR‐515‐p is linked to survival in both lung and breast cancer. (A) Survival analysis of miR‐515‐5p from 195 lung adenocarcinoma samples from the TCGA. (B) Survival analysis of miR‐515‐p from 34 lung squamous cell carcinoma from the TCGA 18. (C) Survival analysis of miR‐515‐5p from 60 breast cancer samples from the Lyng Ditzel Breast Study (GSE37405). (D) Survival analysis of miR‐515‐5p from 33 breast cancer from the GSE7405 Breast study. Analysis and plot were obtained with SurvMicro http://bioinformatica.mty.itesm.mx:8080/Biomatec/Survmicro.jsp for (A–C) and with MIRUMIR for (D).
-
EComparison of miR‐515‐5p expression in 18 primary and matched metastatic lesions from breast cancer patients. miR‐515‐5p levels were quantified by TaqMan qRT–PCR. Absolute values were normalised to U6 snRNA values and displayed as a dot‐plot. Bar: mean; whiskers, SEM.
-
FMDA‐MB‐231 cells were inoculated into the mammary fat pads of nude mice and allowed to form metastatic deposits 19. miR‐515‐5p and MARK4 levels were then determined in the primary and indicated secondary lesions. Data are average ± SEM of technical triplicates.
-
GLuciferase‐expressing A549 cells overexpressing miR‐515‐5p or a non‐targeting control (miR‐NC) were injected in the tail vein of SCID mice and the development of tumour burden monitored by whole‐animal imaging in response to luciferin administration at week 1 and week 4 following injection. (G, left panel) Representative imaging of the same animals for the indicated conditions at week 1 and week 4. Dots colors correspond to luminescence counts as per the scale on the right. (G, right panel) The emitted photons were quantified and the signals normalised to the corresponding readings at week 1. Data represented are representative of three independent experiments.