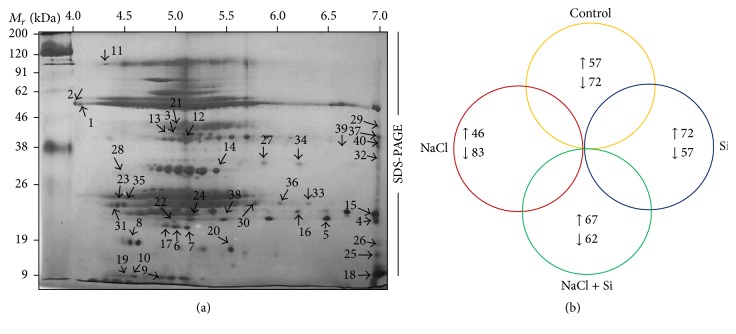
Figure 6.
(a) Master 2DE gel representing the differentially expressed protein spots in pI range 4–7 resolved in 7 cm IPG strip. (b) Venn diagram illustrating the differential expression of C. annuum leaf proteins under Si and salinity treatments. Numbers correspond to the protein spots present in 2DE patterns of control, Si, NaCl, and Si + NaCl treatments. The upward and downward arrows denote increased or decreased protein expression under four treatments.

