
Figure 2.
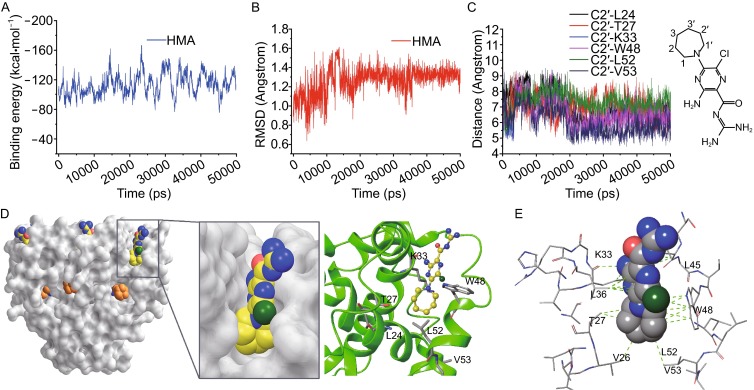
MD simulation refinement of HMA binding site. (A) The binding energy between HMA and other surrounding materials in complex system. (B) RMSD value of heavy atoms between the sampled conformations and the starting conformation of HMA during the 50 ns MD production simulation. (C) The distances between the three key carbons of hexamethylene ring of HMA (the three key carbons, C1, C2, and C3, were indicated in HMA structure) and the backbone N atoms of residues L24, K33, W48, L52, and V53 were monitored during the 50 ns MD production simulation. (The monitored distances between carbon and N atoms are approximately equal to the NOEs data plus 2 Å). (D) Comparison between adamantane binding site and HMA binding site of HCV p7 channels. Left panel: The peripheral pockets that wrap around the adamantane cage of rimantadine (orange) and the hexamethylene group of HMA (yellow). Right panel: A representative pocket of HMA binding among six equivalent pockets in the p7 hexamer. (E) The MD simulation result showing the hydrophobic interactions and the polar interactions between HMA and p7 (5a)