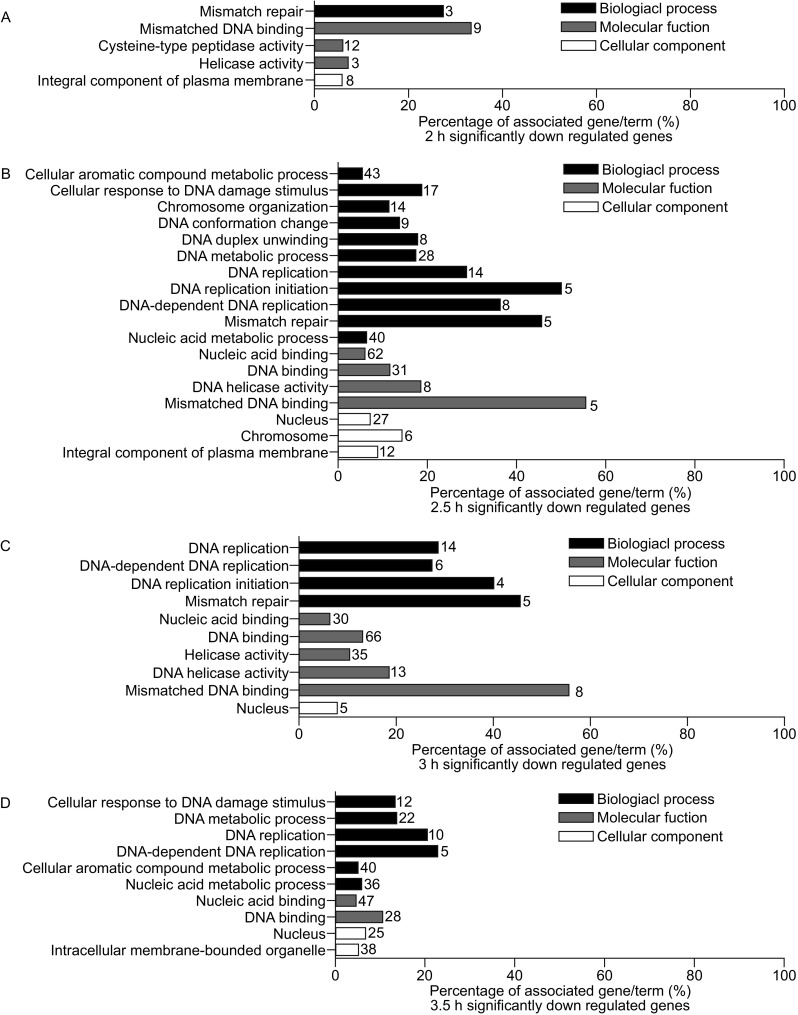
Figure 4.

Gene ontology (GO) enrichment analysis of down regulated genes. The filtered significantly down regulated genes (Log2 (fold change) < −2 and P value < 0.05) of each time point were subjected to GO enrichment analysis separately in biological process, molecular biology, and cellular function. (A) Percentage of associated genes/term (%) at 2 h. (B) Percentage of associated genes/term (%) at 2.5 h. (C) Percentage of associated genes/term (%) at 3 h. (D) Percentage of associated genes/term (%) at 3.5 h. The length of bars from each histogram indicates the percentage of associated genes for each term. The number on top of each bar means the number of associated genes
