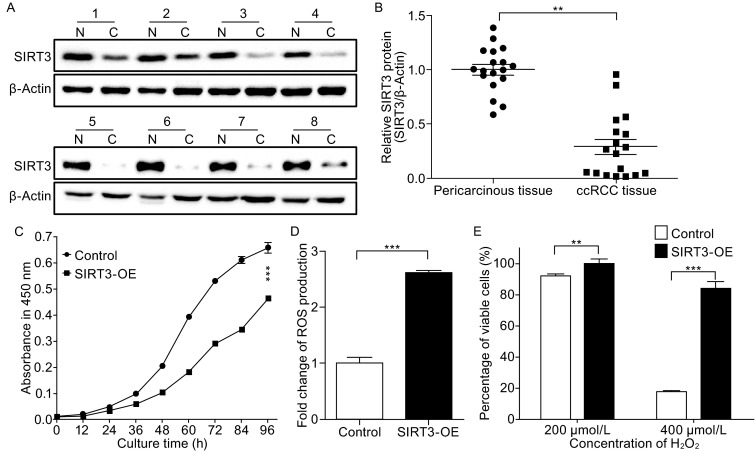
Figure 1.

Downregulation of SIRT3 in ccRCC compared to associated pericarcinous tissues and characterization of SIRT3 overexpression cells. (A) Representative Western blot images of the expression levels of SIRT3 of eight paired samples, N (pericarcinous tissue), C (ccRCC tissue). (B) The gray scale analysis of SIRT3 presented in (A). (C) Growth curve of SIRT3-OE and the control cells. (D) Graphical representation of ROS levels of SIRT3-OE cells compared to the control cells. and (E) Survival rate of SIRT3-OE cells and the control cells treated with different concentration of H2O2 for 12 h. Data were analyzed using student’s t-test. *P < 0.05, **P < 0.01 and ***P < 0.001. *P < 0.05 is considered statistically significant. Error bars represent ±SEM
