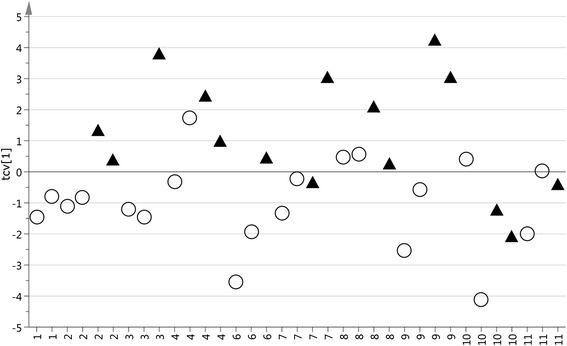
Fig. 1.

Cross-validate score plot separating samples collected before and during treatment. The x-axis consits of the 10 patients included. The circles represent the time points before treatment and the triangles represents the time points during treatment. The OPLS-DA model consisted of 1 predicted and 1 orthogonal component and predicted 31.7 % of the response variation (Q2 = 0.317). The p-value based on ANOVA on the cross-validated OPLS-DA model is 0.01
