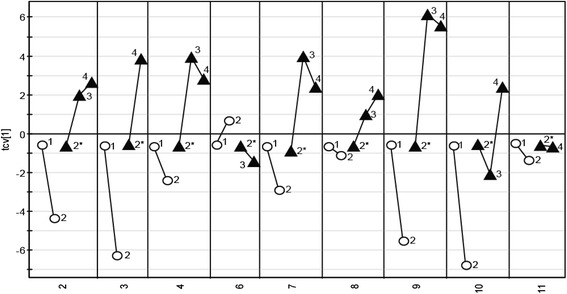
Fig. 2.

Cross-validated score plot based on metabolites in serum affected by treatment. The x-axis consists of the nine patients included. The circles represent the two time points before treatment started and the triangles the time points during treatment. The labels correspond to the sampling time point. 2* was calculated and used as a reference point in ITOT normalization of the treated samples. The OPLS-DA model consisted of 1 predicted and 1 orthogonal component and predicted 31.9 % of the response variation (Q2 = 0.319). The p-value based on ANOVA on the cross-validated OPLS-DA model is 0.006
