Fig. 4.

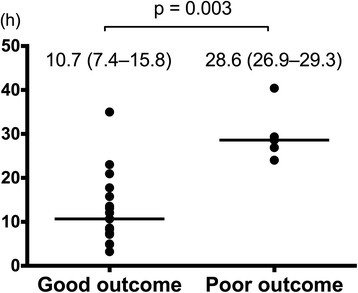
Recovery time of CNV between patients with good outcomes and those with poor outcomes. The CNV recovery time is presented as median (interquartile range). The Mann-Whitney U test was used for the comparison. CNV continuous normal voltage

Recovery time of CNV between patients with good outcomes and those with poor outcomes. The CNV recovery time is presented as median (interquartile range). The Mann-Whitney U test was used for the comparison. CNV continuous normal voltage