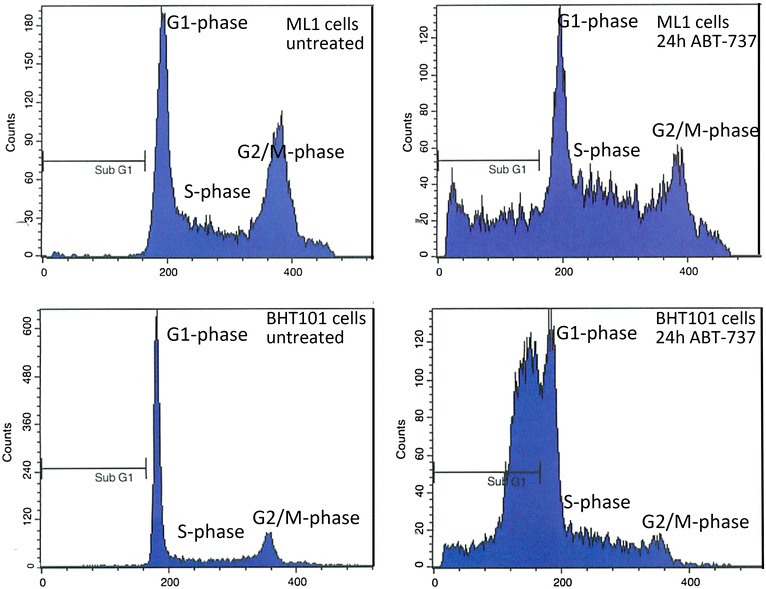
Fig. 2.

Cell cycle changes in ML1 and BHT101 cells after incubation with 1 µM ABT-737 for 24 h. Cell cycle analysis was conducted using FACS, results for ML1 and BHT101 cells are shown as examples. Besides the increase in SubG1 peak, in the remaining living cells an increase in S phase and a decrease in G1 and G2/M phase were observed. Values for all cell lines examined are shown in Table 2
