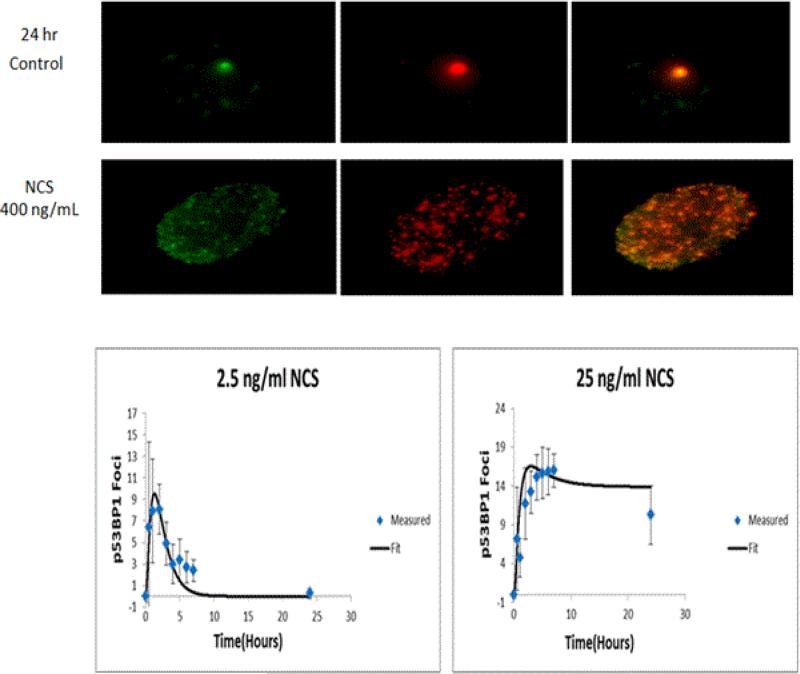
Figure 11. Time-Course Behaviors of DNA-Repair Centers (DRCs) at low and higher doses.
Top: Images of DRC foci in control nuclei. Middle section: images of DRCs following treatment with very high doses of NCS. The foci in individual nuclei show the co-location of two repair proteins – p53 binding protein and γ-H2AX. Lower left: dose- and time-response for DRCs (as foci per nucleus) following treatment with NCS. At lower concentrations (left), foci resolve quickly. At higher concentrations, DRCs persist out beyond 24 hrs. The lower doses are in the sub-threshold region for MN-formation and the higher doses are those with increased MN frequencies. Plots are representative of studies reported in other work from the Hamner-Unilever collaboration [135].

