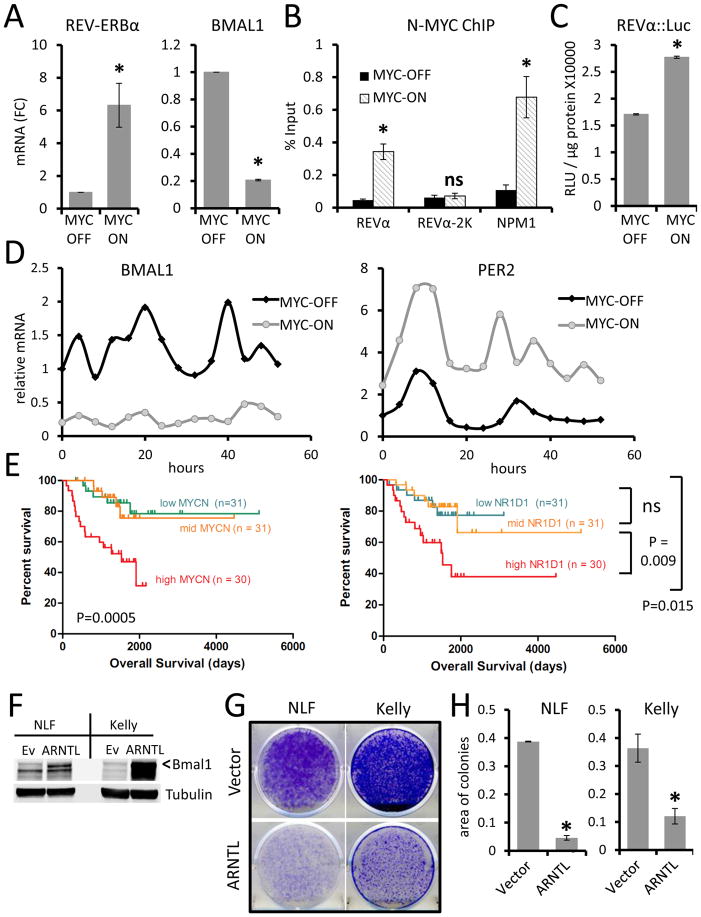
Figure 4. N-MYC directly upregulates REV-ERBa and disrupts circadian rhythm.
A. REV-ERBα and BMAL1 mRNA expression (normalized to expression of β2M) determined by RT-PCR in Shep N-MYC-ER expressing neuroblastoma cells with MYC-ON or MYC-OFF. mRNA (FC) = Fold Change. Means and SDs from at least three experiments are shown. *p < 0.05 by Student’s t test for MYC-ON vs. MYC-OFF. B. Chromatin immunopreciptitation (ChIP) analysis with anti-N-MYC antibody in MYC-ON vs. MYC-OFF in Shep N-MYC-ER cells. ChIP signals (% input) are shown for the Rev-erbα promoter E-box region (REVα, 81 bp region), 2Kb upstream of REV-ERBα transcription start site (REVα-2k), and the promoter of the canonical MYC target nucleophosmin 1 (NPM1). Means and SDs from technical triplicates are shown. *p < 0.05 by Student’s t test for MYC-ON vs. MYC-OFF. Data are representative of three or more experiments. C. Activity of the REV-ERBα promoter::luciferase construct (−1156 to +31 region) in Shep N-MYC-ER-expressing cells expressing under MYC-ON vs. MYC-OFF conditions. RLU: relative light unit. Means and SDs from triplicate samples are shown, and *p < 0.05 by Student’s t test for MYC-ON vs. MYC-OFF. Data are representative of three or more experiments. D. Time-series (every 4h) expression of BMAL1 (left panel) or PER2 (right panel) mRNA (relative to β2M) determined by RT-PCR in synchronized Shep N-MYC-ER-expressing cells with MYC-ON or MYC-OFF. Data are representative of two or more experiments. E. Kaplan-Meier survival analysis of patients with neuroblastoma expressing different levels of MYCN or (REV-ERBα) NR1D1 analysis grouped by tertiles based on individual gene expression. Log rank p-values shown. F. Ectopic expression of BMAL1 (ARNTL, indicated by <) in high MYCN neuroblastoma cell lines NLF and Kelly determine by immunoblotting Tubulin serves as loading control. G. Colony suppression assay of cells treated with 1mg/ml G418 showed that ectopic expression of ARNTL suppressed colony formation capacities of NLF and Kelly cells as compared with vector control (ev). H. Quantitation of colony suppression by ARNTL determined by area of colonies on culture plates measured by ImageJ. n = 3, error bars represent SD. *p <0.05 by Student’s t-test.

