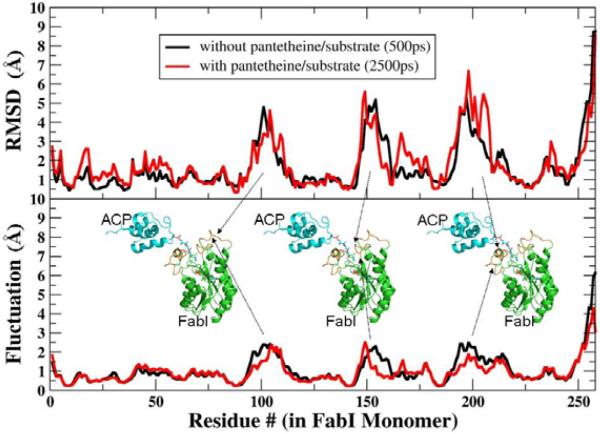
Figure 3. RMSD Values and Fluctuations for Each FabI Residue During MD Simulations of the Complex.
Average RMSD values and positional fluctuations for each residue in FabI during simulations of the complex without substrate (black lines) and after drawing the substrate into the active site (red lines). Most regions of the protein have deviations of only 1–2Å from the crystal structure, while several loop regions (indicated by the arrows) show larger RMSD values that arise from increased, as indicated by higher fluctuations. These loops show similar behavior in the presence and absence of the substrate.

