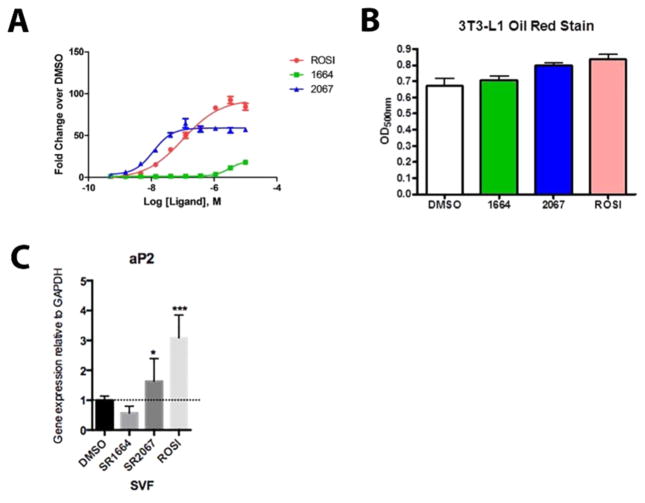
Figure 2.
Transcriptional activation data. (A) EC50 values were derived from dose–response curves of full agonist rosiglitazone, partial agonist SR2067, and antagonist 1664. (B) Oil red staining of differenrtiated 3T3-L1 cells after treatement with either the full agonist rosiglitzaone, partial agonist SR2067, or antagonist SR1664. (C) qPCR analysis of the PPARγ target gene aP2 (FABP4) in SVF cells treated with either the full agonist rosiglitazone, partial agonist SR2067, or antagonist SR1664.

