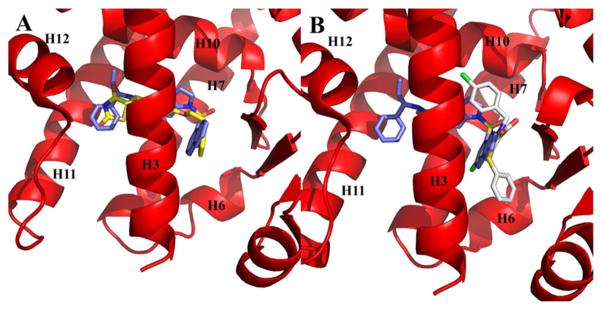
Figure 4.
Comparison of SR2067 to the PPARγ full agonist and partial agonist binding modes. The PPARγ LBD is shown as ribbons (red), and SR2067 (blue), rosiglitazone (yellow), and nTZDpa (white) are shown as sticks. (A) Comparison by superimposition of the rosiglitazone and SR2067 binding modes (rosiglitazone PDB: 2PRG). (B) Comparison by superimposition of the nTZDpa and SR2067 binding modes (nTZDpa PDB: 2Q5S).

