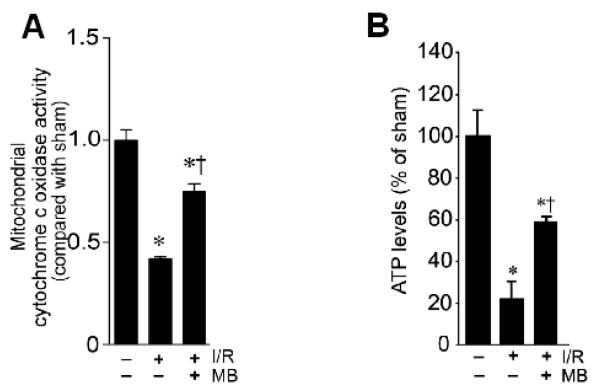
Fig. 2.
Effects of MB on mitochondrial cytochrome c oxidase activity and total ATP levels after GCI. A: Total protein samples from CA1 region at 2 day reperfusion were subjected to activity analysis for mitochondrial cytochrome c oxidase. B: ATP assay in total protein samples from CA1 region indicates that MB treatment significantly increases total ATP levels compared with control group at ischemic reperfusion day 2. N= 4-5 in each group. *P<0.05 versus sham control, †P< 0.05 vs. ischemic control group without MB treatment.

