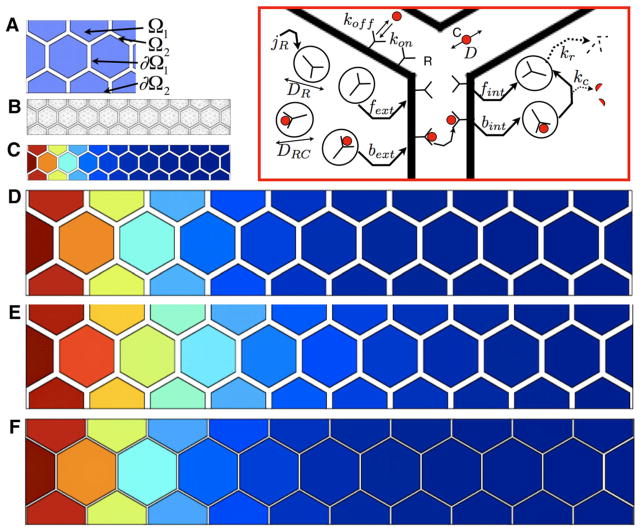
Fig. 10.
a The geometry labels for subdomains and boundaries for the hexagonally packed array of cells. b The mesh for the finite element analysis. c The relative level of the total number of receptors bound to ligand per cell (red is the maximum level set to 1 and blue is zero) for an array of ten cells that span 70 μ. d Results from (c) stretched out threefold to compare with computed solutions in (e) and (f). e Computed distribution of ligand if the geometry in (c) is uniformly scaled threefold. Note that the color mapping in (e) extends farther than the color profile in (d). f Same as (e), except now the distance between adjacent cell surfaces is equal to the spacing in (c). Note that the color mapping does indeed scale [compare (f) and (d)]

