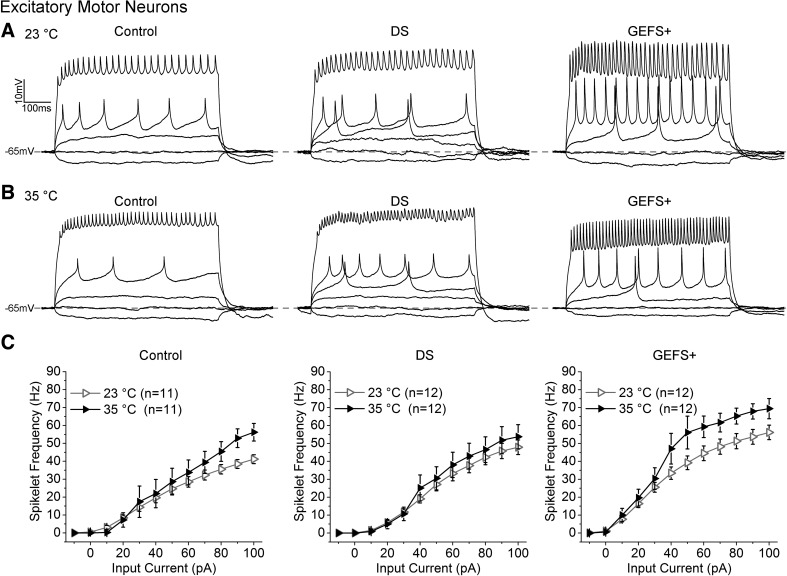
Fig. 3.
A and B: representative trains of evoked spikelets recorded from control, DS, and GEFS+ motor neurons (MNs) at 23 and 35°C. C: average spikelet frequency plotted as a function of injected current for control, DS, and GEFS+ MNs. Symbols and error bars represent means ± SE from the number (n) of MNs indicated.

