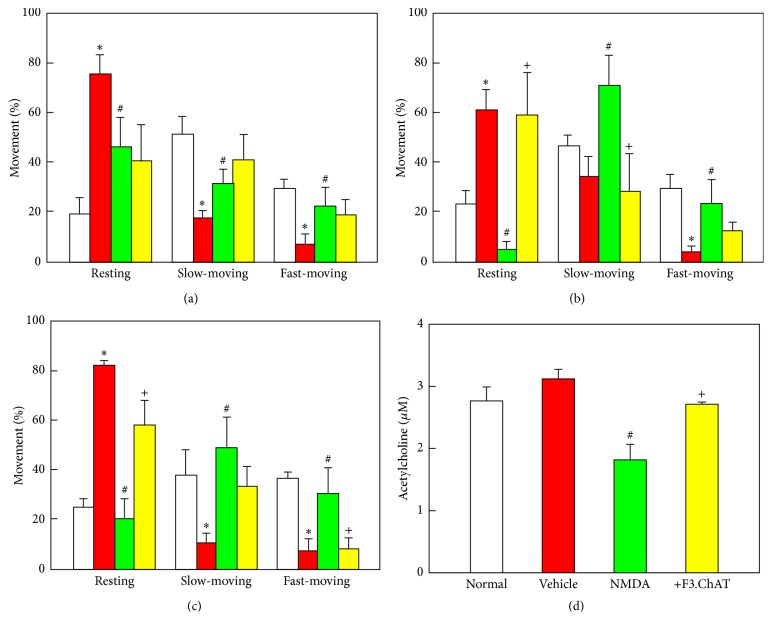
Figure 3.
Locomotor activity of rats that encountered cat odor (a–c) and acetylcholine concentration (d). Spontaneous movements (resting and slow-moving and fast-moving times) were analyzed immediately before (a) and 2 weeks (b) and 4 weeks (c) after F3.ChAT cell transplantation following N-methyl-d-aspartate (NMDA) injection (−2 weeks), and acetylcholine was analyzed in cerebrospinal fluid 4 weeks after transplantation (d). White, normal environment (without cat odor) + vehicle (saline for NMDA and cells); red, cat odor + vehicle; green, cat odor + NMDA + vehicle; yellow, cat odor + NMDA + F3.ChAT cells. ∗Significantly different from normal control (P < 0.05). #Significantly different from vehicle control (P < 0.05). +Significantly different from NMDA alone (P < 0.05).

