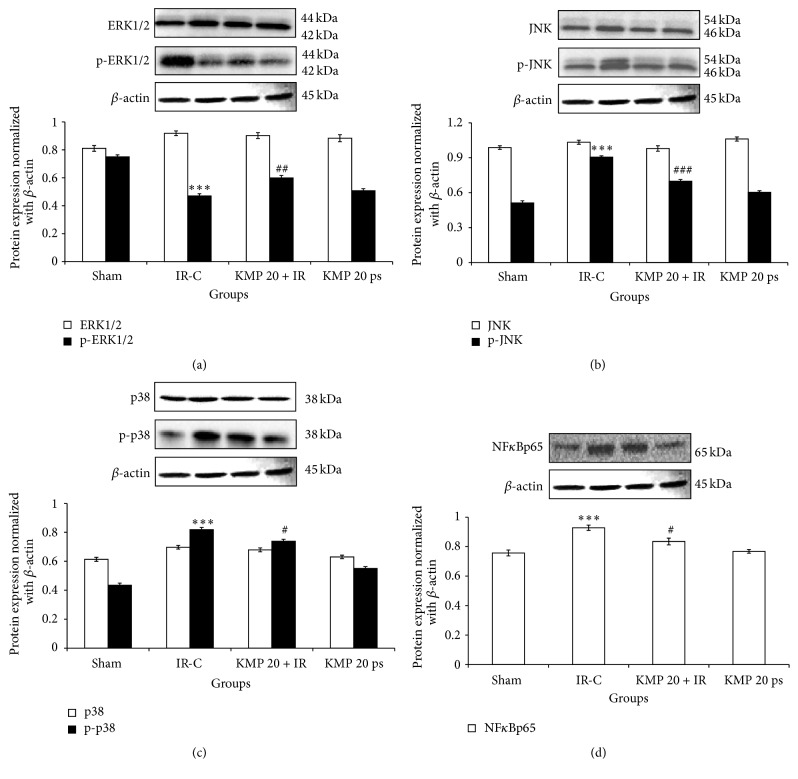
Figure 4.
Effect of KMP on MAPKs protein expressions. (a) ERK1/ERK2, p-ERK1/ERK2; (b) JNK, p-JNK; (c) p38, p-p38; (d) NFκBp65. Data are expressed as normal intensity (% control). All the values are expressed as mean ± SEM; n = 3 per group. ∗∗∗ p < 0.001 versus sham; # p < 0.05; ## p < 0.01; ### p < 0.001 versus IR-control.

