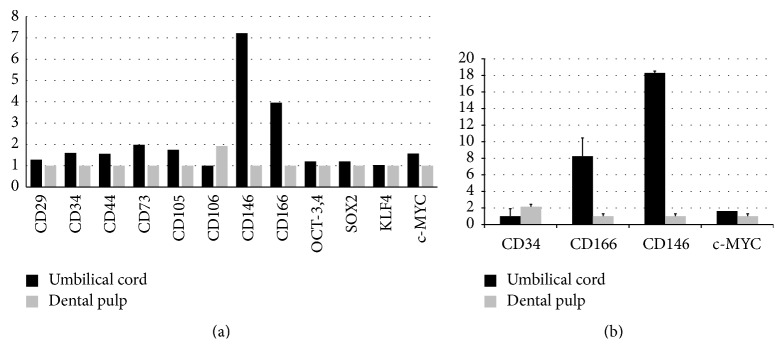
Figure 2.
Relative gene expression of mesenchymal stem cell and induced pluripotent stem cell markers using cDNA microarray (a). The relative differences in the expression of stem cell markers between umbilical cord and dental pulp were analyzed using qRT-PCR (b). Data are presented as means ± standard deviation and expressed as the relative change by applying the equation 2−ΔCt, where ΔCt = Ct of the gene minus Ct of the 18S rRNA.

