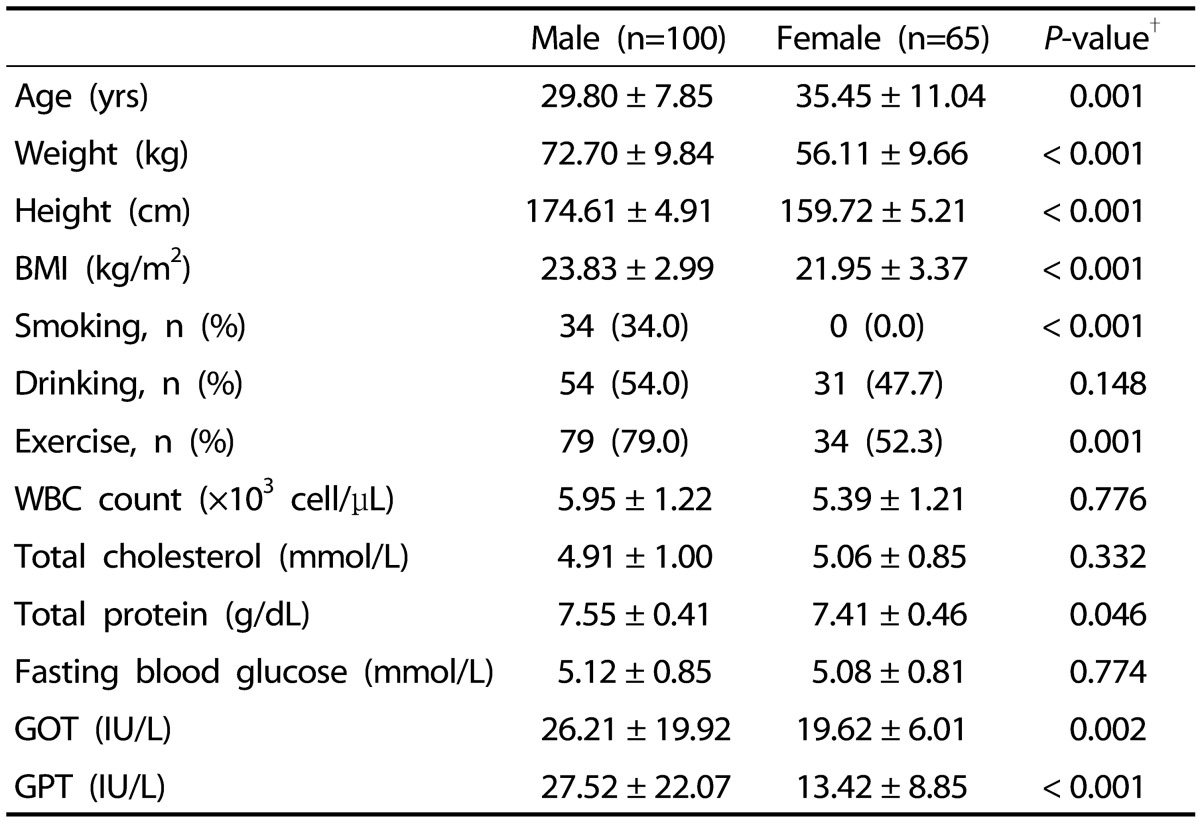
Table 1. Characteristics of male and female participants.
Values are means ± standard deviation or number of participants (percentage distribution), as appropriate. BMI, body mass index; GOT, glutamic oxaloacetic transaminase; GPT, glutamic pyruvic transaminase; exercise, ≥ twice a week.
†P-values were analyzed by independent t-test and Chi-square test.

