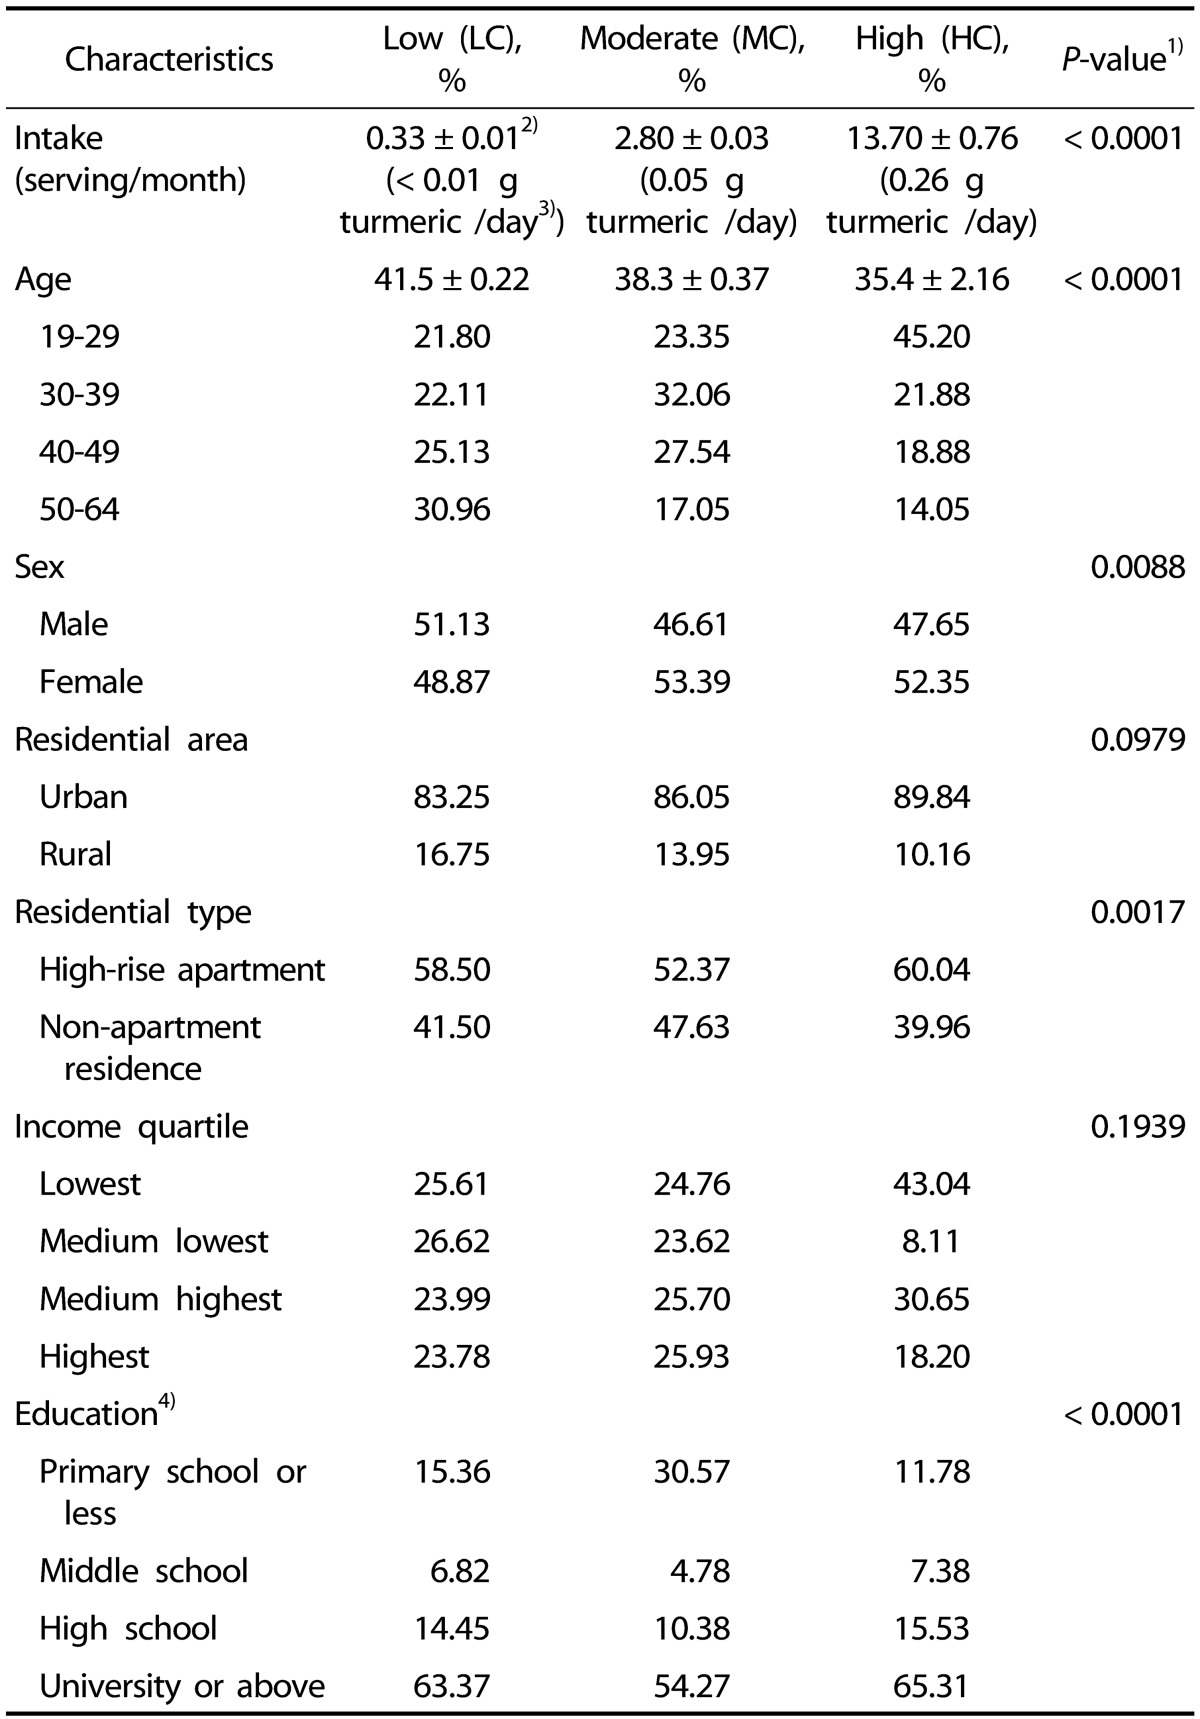
Table 3. The demographic characteristics of individuals with different levels of curry consumption.
1)The significance of the differences in the frequencies and means between the low and moderate curry consumption groups was tested using t-test and chi-squared tests, respectively.
2)Mean ± SE
3)Daily turmeric consumption based on about 0.56 g turmeric in one serving of curry rice and 30 days per month.
4)Frequency was age-adjusted.

