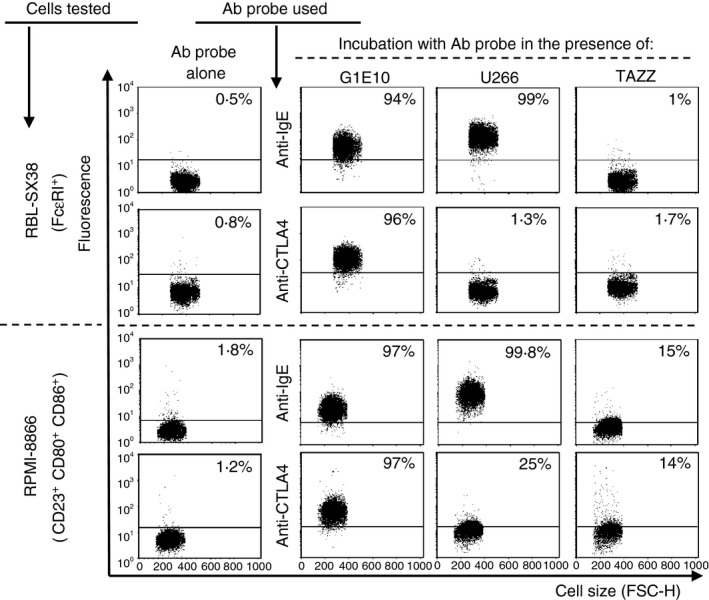
Figure 2.

CTLA4Fcε binds to cells displaying CTLA‐4 counter‐receptors and Fcε receptors. Human Fcε RI + RBL‐SX38 or CD23+ CD80+ CD86+ RPMI‐8866 cells were suspended in culture supernatant harvested from: (i) the cell line used for CTLA4Fcε DNA expression (TAZZ), (ii) the transfectoma producing CTLA4Fcε (G1E10), or (iii) a human IgE‐producing cell line (U266), in the presence of phycoerythrin (PE) ‐labelled anti‐human IgE or anti‐mouse CTLA‐4. Samples were analysed by flow cytometry and results are shown as representative dot plots of cell size (FCS‐H) versus signal in the relevant fluorescence channel. Binding of CTLA4Fcε (or IgE) was estimated as the change in fluorescence intensity (FI) of events analysed under each experimental condition compared with the basal FI value offered by a sample incubated with the antibody probe alone. This change was expressed as a percentage of positive events (inset values in each dot plot) defined as those found above an arbitrary cut‐off line. The results shown come from a single experiment and are representative of at least three independent experiments, each performed in duplicate.
