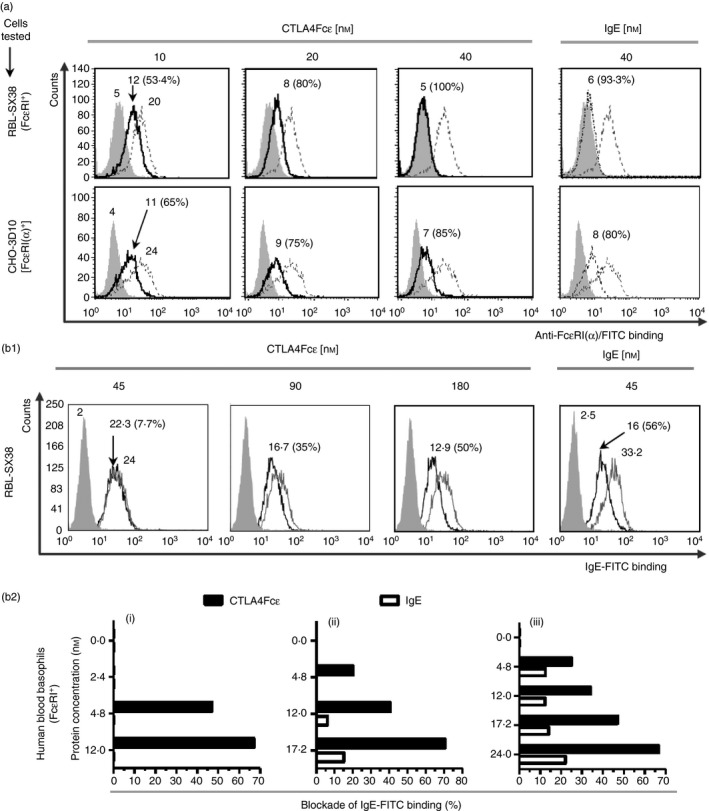
Figure 3.

CTLA4Fcε binds to Fcε RI. (a) Flow cytometric analysis of Fcε RI + RBL‐SX38 or Fcε RI α + CHO‐3D10 cells incubated with CTLA4Fcε or IgE at the indicated concentrations, and subsequently stained with an FITC‐labelled anti‐human Fcε RI α monoclonal antibody (mAb) (clone CRA2, which recognizes the IgE‐binding site of Fcε RI). Binding of CTLA4Fcε or IgE to Fcε RI was estimated as the reduction in the anti‐Fcε RI α‐related mean fluorescence intensity (MFI). Grey‐filled histograms show the fluorescence of the sample incubated with the antibody isotype; empty grey‐lined histograms, the fluorescence of the sample incubated with anti‐Fcε RI α/FITC; and empty black‐lined histograms, the fluorescence of the sample incubated with anti‐Fcε RI α/FITC in the presence of CTLA4Fcε or IgE. Inset numbers shown within select histograms are MFI values or percentage of inhibition. (b1) CTLA4Fcε blocks the binding of IgE to Fcε RI on RBL‐SX38 cells. Cells were incubated in culture media containing IgE/FITC at a fixed concentration (45 nm of IgE), mixed with either CTLA4Fcε at different concentrations or ‘cold’ IgE at a fixed concentration (45 nm). Samples were analysed by flow cytometry and a reduction of the IgE/FITC‐related MFI was assumed to be the result of the occupancy of Fcε RI sites by CTLA4Fcε or ‘cold IgE’. The percentage of inhibition was calculated. Grey‐filled histograms show the autofluorescence of the control sample; empty grey‐lined histograms, the fluorescence of the sample incubated with IgE/FITC; and empty black‐lined histograms, the fluorescence of the sample incubated with IgE/FITC in the presence of CTLA4Fcε or ‘cold’ IgE. Inset numbers represent the same values indicated in (a). The results shown in (a) and (b1) come from a single experiment and are representative of at least three independent experiments, each performed in duplicate. (b2) CTLA4Fcε blocks IgE binding to Fcε RI on human peripheral blood basophils. Blood samples (i, ii, iii) were processed to elute endogenous IgE and treated as outlined in (b1). Basophils present in these samples were hierarchically gated according to their relative size (FSC‐H) versus granularity (SSC‐H), followed by CD203c/Fcε RI expression. Then, they were analysed to determine the IgE/FITC‐related fluorescence, and the percentage of blockade was calculated.
