
Figure 5.
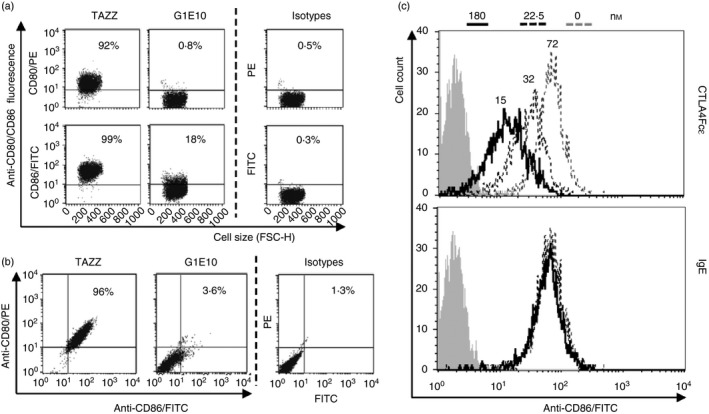
CTLA4Fcε binds to B7 molecules. (a) Aliquots of CD23+ CD80+ CD86+ RPMI‐8866 cells were incubated in mixes containing supernatant harvested from TAZZ or G1E10 cell cultures and fluorescent anti‐CD80 or anti‐CD86 blocking monoclonal antibodies (mAbs), and analysed by flow cytometry. Representative dot plots show that the vast majority of cells suspended in TAZZ supernatant were labelled with anti‐CD80 or anti‐CD86 (92% and 99% of the events analysed, respectively). Conversely, the samples suspended in G1E10 supernatant were only marginally labelled (anti‐CD80, 0·8%; anti‐CD86, 18%). (b) Aliquots of RPMI‐8866 cells were treated as indicated in (a), but adding both fluorescent anti‐CD80 and anti‐CD86 reagents to TAZZ and G1E10 supernatants. Samples were analysed by flow cytometry and results are shown in representative dot plots. Incubation of the cells under these conditions led to an almost complete reduction of the CD80‐ and CD86‐specific labelling in the case of the supernatant G1E10. (c) Overlaid histograms show representative flow cytometric analysis of samples of RPMI‐8866 cells incubated with anti‐human CD86/FITC mixed with two different concentrations (as indicated in the legend at the top of the figure) of purified CTLA4Fcε or IgE. CTLA4Fcε, but not IgE, was able to reduce anti‐CD86/FITC‐related fluorescence in a concentration‐dependent manner. Inset numbers in the top histogram are mean fluorescence intensity (MFI) values obtained for each condition tested. The results shown in (a) and (b) come from a single experiment and are representative of three independent experiments, each performed in duplicate.