
Figure 7.
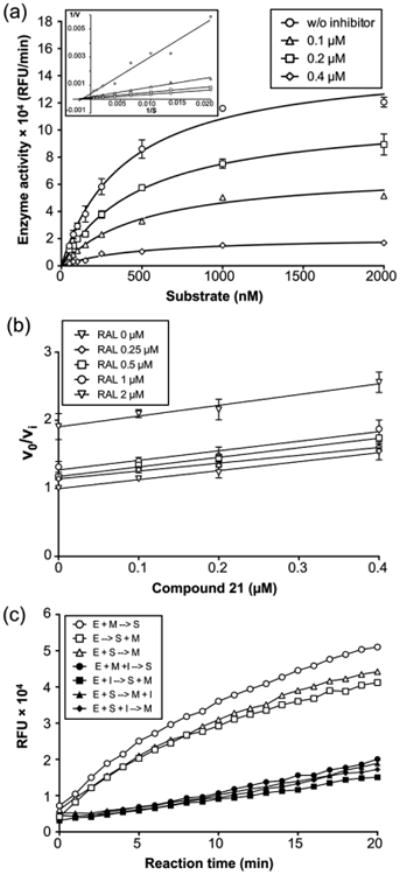
Kinetic analysis of pUL15C inhibition. (a) Michaelis–Menten kinetic plot of pUL15C nuclease activity in the presence of various compound 21 concentrations: 0.1 (△), 0.2 (□), and 0.4 μM (◇). Empty circles represent the no inhibitor control. The graph is representative of three independent experiments. A Lineweaver–Burke plot is presented in the inset, indicating compound 21 is a noncompetitive inhibitor. (b) Yonetani–Theorell plot for compound 21 and RAL. The inhibitory activity (defined as νo/νi) for each concentration of compound 21 (0, 0.1, 0.2, 0.4, and 0.8 μM) is plotted as a function of the concentration of RAL (0, 0.25, 0.5, 1, and 2 μM). The assay was performed at fixed concentrations of substrate (250 nM). Parallel lines for the two inhibitors indicate they are mutually exclusive. (c) Effect of the order of addition on the pUL15C activity of compound 21. The inhibitory activity of compound 21 was evaluated under seven different conditions, having the same composition but different order of addition of enzyme (E), substrate (S), Mn2+ (M), and inhibitor (I): preincubation of E and M, hydrolysis initiated with S (○); E alone, hydrolysis initiated with S and M (△); preincubation of E and S, hydrolysis initiated with M (□); preincubation of E, M, and I, hydrolysis initiated with S (●); preincubation of E and I, hydrolysis initiated with S and M (■); preincubation of E and S, hydrolysis initiated with M and I (▲); and preincubation of E, S, and I, hydrolysis initiated with M (◆). Preincubation was conducted at room temperature for 10 min. Reaction mixtures were incubated at 37 °C in an Infinite M1000 PRO plate reader for 20 min, and fluorescence was measured at 1 min intervals.