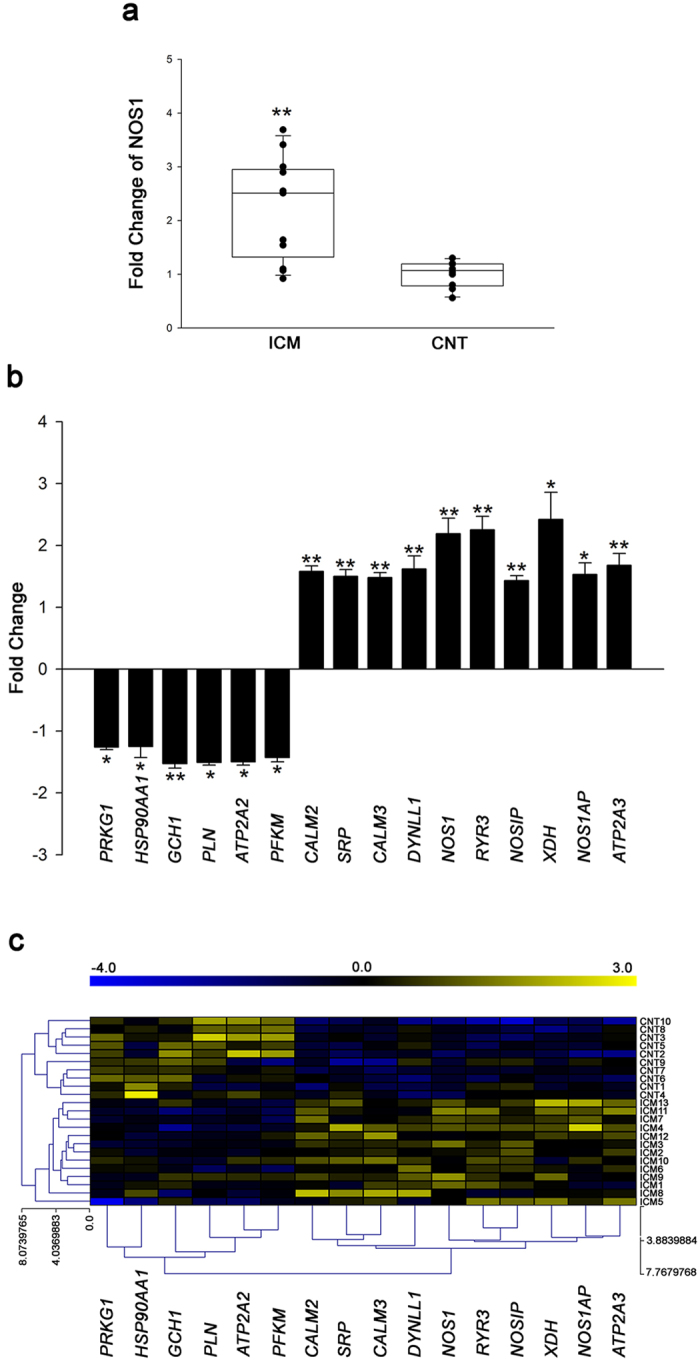
Figure 1. mRNA expression levels of altered NOS-related genes involved in regulating physiological function of myocyte in human ischemic hearts.

(a) Boxplot with dots of mRNA relative expression levels of NOS1. Middle line in box represents the median, lower box bound the first quartile, upper box bound the third quartile, whiskers the 95% confidence interval of the mean. (b) The graph shows the values obtained by RNA-sequencing. The values from the controls were set to 1. Fold change (FC) units represent the fold induction over CNT of mRNA relative expression levels. Bars display FC ± SEM (standard error of the mean). (c) Heat map and hierarchical clustering based on the FC values. Heat map and hierarchical clustering analyses shows the separation of both ICM and CNT groups. Columns: genes; rows: samples. Colors depict the relative expression level of each gene; blue: lowest, yellow: highest. *P < 0.05, **P < 0.01 versus the CNT group.
