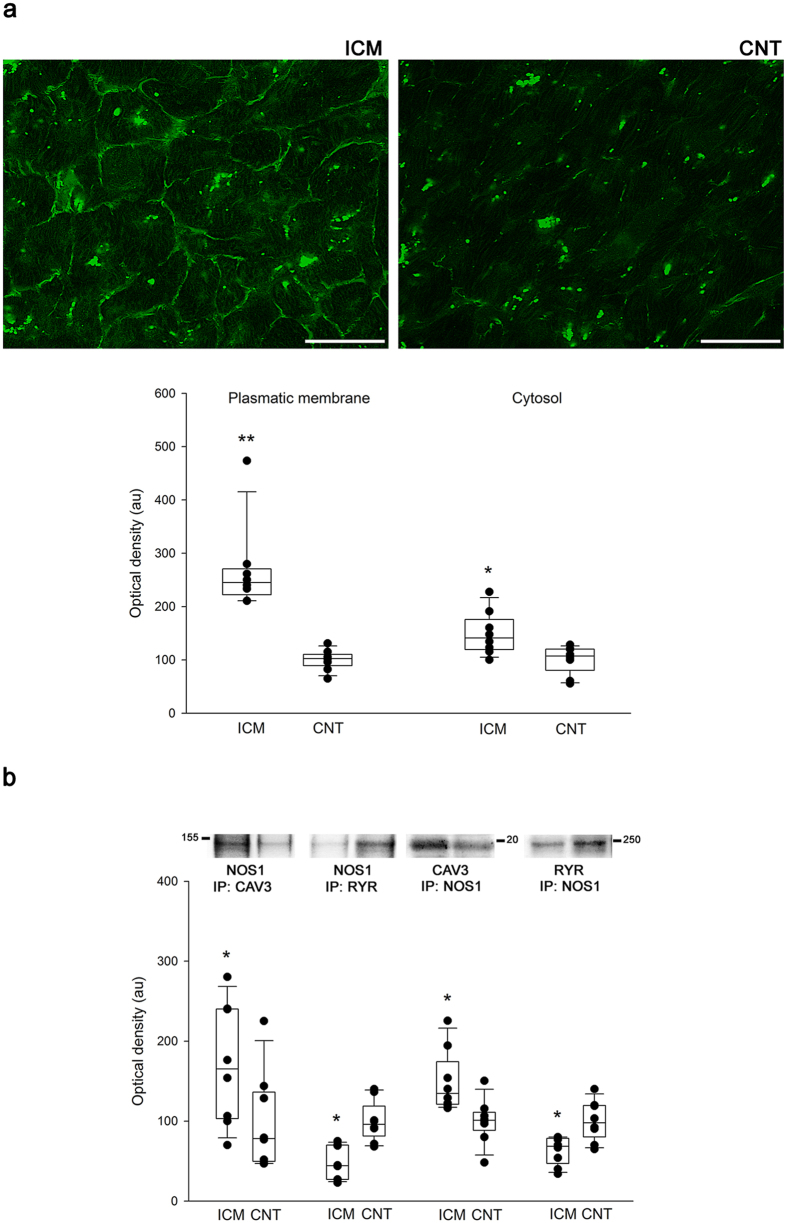
Figure 3. Nitric oxide synthase 1 translocation in human ischemic hearts.
(a) The bar represents 100 μm. The green aggregated spots are lipofucsin particles (intense green in cytosol). Boxplot with dots comparing NOS1 fluorescence intensity in the membrane and cytosol in control compared to ischemic hearts. (b) Association between NOS1 and either caveolin 3 or ryanodine receptor. Immunoprecipitates (IP) were immunoblotted for NOS1, caveolin 3 or RyR, respectively. In the boxplots with dots the middle line in box represents the median, lower box bound the first quartile, upper box bound the third quartile, whiskers the 95% confidence interval of the mean. *P < 0.05, **P < 0.01 versus the CNT group.

