Figure 2.
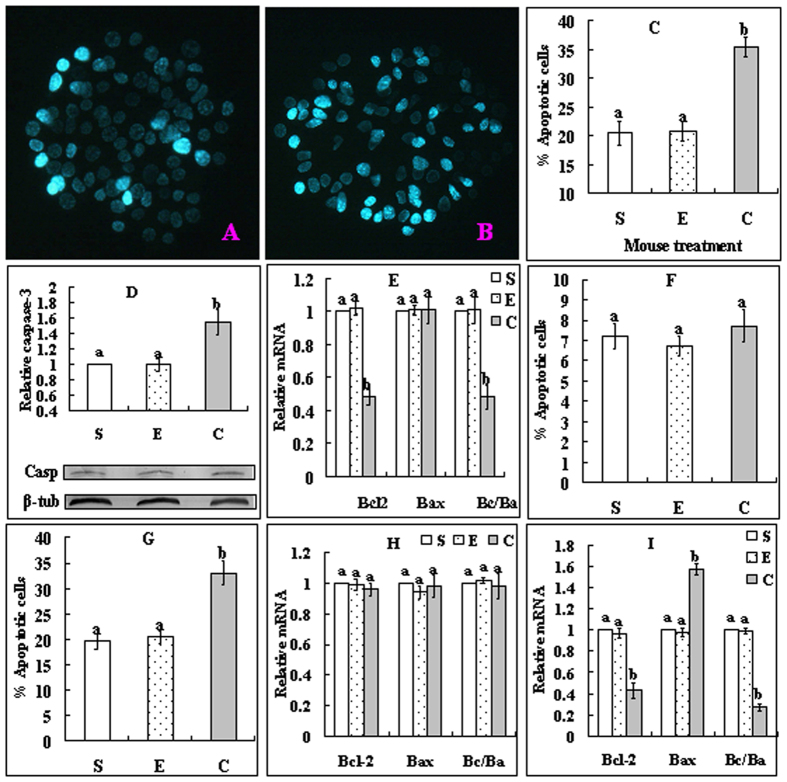
Effects of cortisol injection on apoptosis of MGCs (A–E) and CCs (F–I). Female mice were injected with saline (S), ethanol (E) or 50 mg/kg cortisol (C). A and B are MGCs smears stained with Hoechst 33342 and observed under a fluorescence microscope (Original magnification ×400), which show MGCs from mice injected with saline or cortisol, respectively. The heterochromatin is heavily stained with the Hoechst dye and gives bright fluorescence. Whereas the apoptotic cells show pyknotic nuclei full of heterochromatin, healthy cells show normal nuclei with sparse heterochromatin spots. Graph C shows percentages of apoptotic MGCs after different mouse treatments. Graph D shows levels of active caspase-3 while graph E shows Bcl2 and Bax mRNAs and Bcl2/Bax (Bc/Ba) ratio in MGCs after different mouse treatments. Graphs F and G show percentages of apoptotic CCs while graphs H and I show levels of Bcl2 and Bax mRNAs and Bcl2/Bax ratio in CCs, before and after oocyte culture without SGH, respectively. In all the experiments, each treatment was repeated 3 times. For the MGC experiments, each replicate included MGCs from 2 mice. For CCs Hoechst staining, each replicate contained 60 oocytes from 2 mice. For RT-PCR with CCs, each replicate contained CCs from 200 oocytes from 6–7 mice. a,b: Values without a common letter above their bars differ significantly (P < 0.05) within apoptotic markers.

