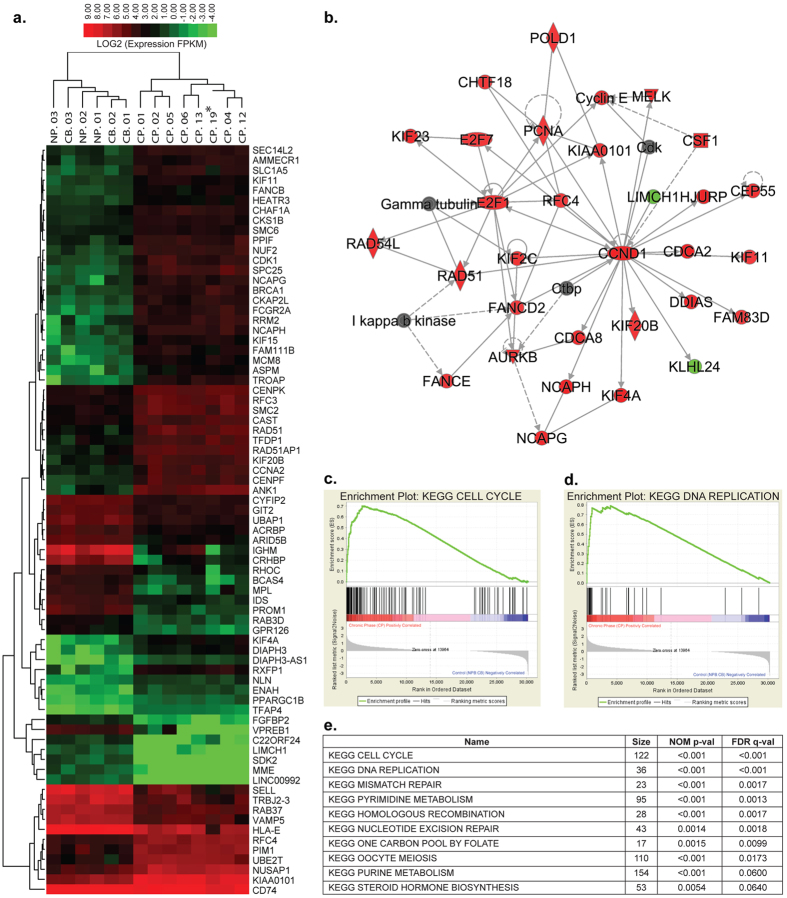
Figure 1. RNA-seq identifies distinct differences in DNA replication and cell cycle gene expression in normal and chronic phase CML progenitor cells.
(a) Heatmap from agglomerative hierarchical clustering of GSEA top ranked genes between 8 chronic phase CML (CP), 3 normal peripheral (NP) blood and 3 cord blood (CB) samples using RNA-seq data. Red indicates higher expression values and green indicates lower expression values (Log2 FPKM scale). (b) Ingenuity® Pathway Analysis performed on statistically significant genes (p < 0.05) between CP (n = 8) and normal (n = 6, 3 NP, 3 CB): RNA-seq expression data reveals cyclin D1 (CCND1) as a major hub. Arrows indicate interaction directionality. Red indicates increased expression and green indicates decreased expression in CP relative to NP. (c,d) Enrichment plots for KEGG Cell Cycle and DNA Replication pathways from Gene Set Enrichment Analysis (GSEA) between 8 CP and 6 normal (3 CB, 3 NP) samples using RNA-seq gene expression data indicate enrichment of these pathways in CP relative to NP. (e) GSEA Summary table obtained from RNA sequencing data comparing 8 CP to 6 normal (3 CB, 3 NP) samples confirms Cell Cycle and DNA Replication pathways as significant to CP and normal differential expression.

