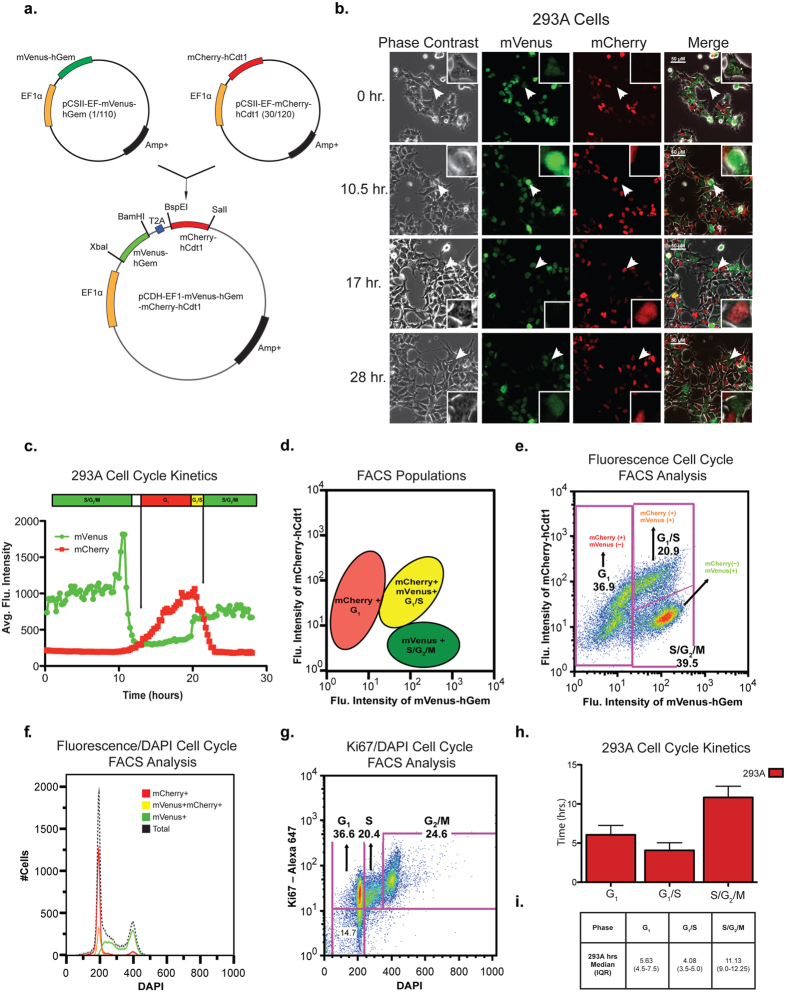
Figure 2. Fucci2BL vector generation and characterization.
(a) Diagram and map of construct design and generation. Both mVenus-hGem(1/110) and mCherry-hCdt1 (30/120) were subcloned into a pCDH-EF1α-T2A lentiviral expression vector. (b) Temporal analysis of confocal images generated from lentiviral transduced 293A cells stably expressing fluorescent reporters. White arrows mark which cell was tracked to analyze cell cycle kinetics. (c) Cell cycle kinetics was determined from average fluorescence intensity from marked cells expressing reporters. (d) Diagram representing location of specific cell populations (mCherry+, mCherry+mVenus+, mVenus+) identified by FACS analysis. (e) Live cell FACS analysis of 293A cells stably expressing fluorescent reporters. (f) DNA content analysis using DAPI stain on 293A cells stably expressing fluorescent reporters. (g) Cell cycle FACS analysis using Ki-67 staining and DAPI on 293A cells stably expressing fluorescent reporters. (h) Cell cycle kinetics of 293A (n = 10) cells represented in hours. (I) Duration of cell cycle phase represented by median (hours) for 293A (n = 10) cells.

