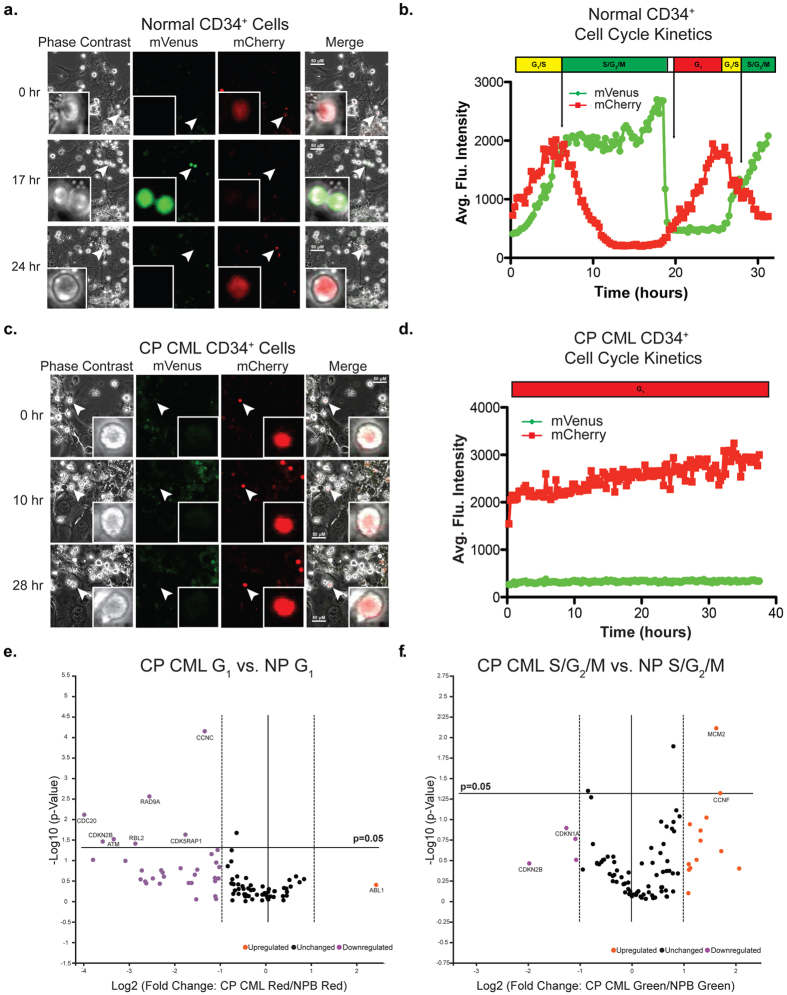
Figure 3. Live cell imaging of stromal co-cultures distinguishes differences in cell cycle kinetics between chronic phase CML (CP) and normal peripheral blood (NP) CD34+ cells.
(a) Temporal analysis of confocal images generated from lentiviral transduced CD34+ selected NP cells grown on SL/M2 co-culture with bicistronic fluorescent reporter. White arrows mark which cell was tracked to analyze cell cycle kinetics. (b) Cell cycle kinetics was determined from average intensity of fluorescence from marked cells (white arrow) expressing Fucci2BL reporter. (c) Temporal analysis of confocal images generated from lentiviral transduced CD34+ selected (CP) cells grown on SL/M2 co-culture with bicistronic fluorescent reporter. White arrows mark which cell was tracked to analyze cell cycle kinetics. (d) Cell cycle kinetics was determined from average intensity of fluorescence from marked cells expressing reporters. (e) Volcano plot of CP CML (G1) phase (n = 3) differential cell cycle gene expression compared to NP (G1) phase (n = 3). Orange circles indicate genes expressed greater than +1.0 Log2 fold change in CP CML (G1) vs NP (G1). Magenta circles indicate genes downregulated and expressed less than −1.0 Log2 fold change in CP CML (G1) vs NP (G1). (f) Volcano plot of CP CML (S/G2/M) phase (n = 3) differential cell cycle gene expression compared to NP (S/G2/M) (n = 3). Orange and magenta indicate same nomenclature as above.

