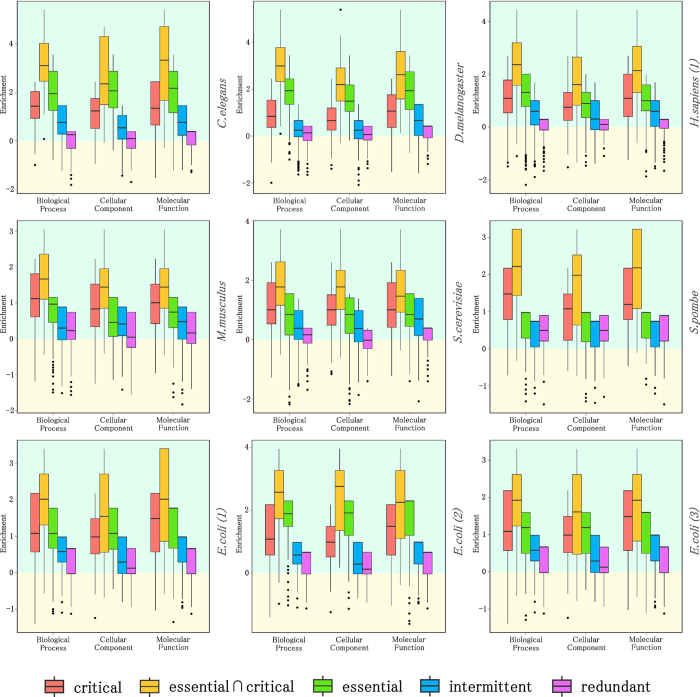
Figure 4. The box-and-whisker plot of the proteins enriched for each Gene Ontology annotations: biological process, molecular function, and cellular component.
Each protein was classified into five categories based on whether it is engaged in critical (red), intermittent (blue) or redundant (purple) network control and also on whether it plays an essential (green) or an essential and critical control role simultaneously (orange). The calculation of the enrichment of each category was then calculated as shown in the Methods section. The results show that those essential proteins engaged in critical control (orange) also show the highest enrichment in biological process, molecular function and cellular component annotations. The strongest signal for their associations with GO categories corresponds to H. sapiens, S. cerevisiae, C. elegans, D. melanogaster and E. coli organisms. Each organism is indicated in the figure. E. coli organisms show results for three different essential gene datasets, respectively. The results for H. sapiens (1) are shown in figure. For the rest of datasets for H. sapiens we obtained very similar results. The statistics and data sources for the essential genes are shown in Table S2. Additional statistical data is shown in Table 2 in main text and Tables S6 and S7 in SI. See also Supplementary Excel files for additional data.

