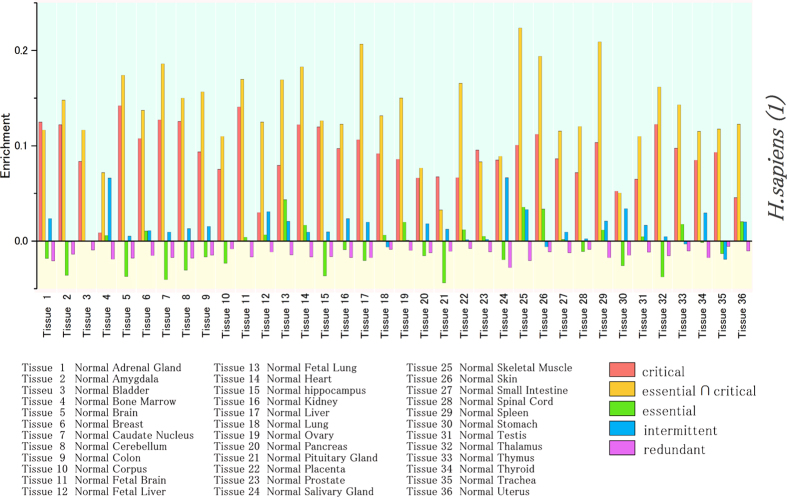
Figure 5. Enrichment of co-expressed genes for each category: critical (red), intermittent (blue), redundant (purple), essential (green) and simultaneously essential and critical control roles (orange) across 36 different healthy human tissues.
The subset of co-expressed critical genes that are also annotated as essential genes exhibit the highest enrichment in almost all tissues. The analysis is performed for three different datasets of essential genes as shown in Table S2. The results for H. sapiens (1) dataset are shown in figure. The results for the rest of datasets for H. sapiens are shown in Fig. S20 in SI.

