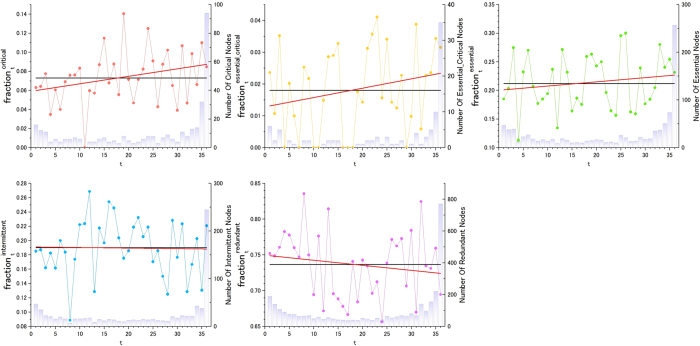
Figure 6.
The fraction of genes in a particular set of critical (a), essential and critical (b), essential (c), intermittent (d) or redundant (e) genes among genes whose transcripts are expressed in t tissues, from 1 to 36. For each figure (a–d), the scale for the grey bars is marked on the right axis and indicates the number of proteins found in each tissue. The fraction of critical and essential critical proteins increases when the number of tissues in which they are expressed also increases. The essential gene dataset corresponds to H. sapiens (1). The results from two other human essential gene datasets are shown in SI.

