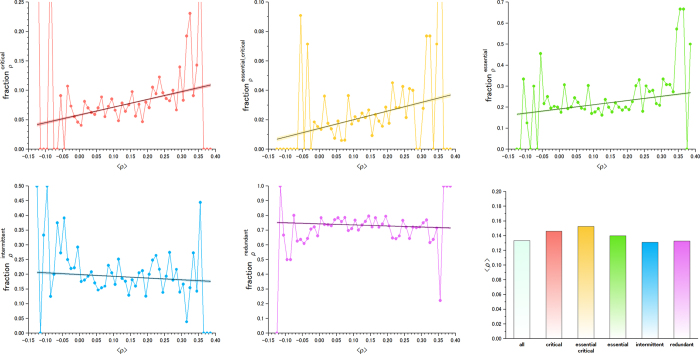
Figure 7.
The fraction of genes for each category (critical (a), critical and essential (b), essential (c), intermittent (d) and redundant (e)) among those whose average Pearson Correlation Coefficient (PCC) with all other genes in the cell is <ρ>. See the Methods section for details. (f) The PCC averaged for all genes included in each category. The essential gene dataset corresponds to H. sapiens (1). The results for two other human essential gene datasets are shown in SI. The linear fit to the data (black line) also shows the 95% confidence band in the same colour as the data points. When it is too small, it may not be visible. The exact p-values for the analysis of statistical significance analysis are shown in SI, Table S5.

