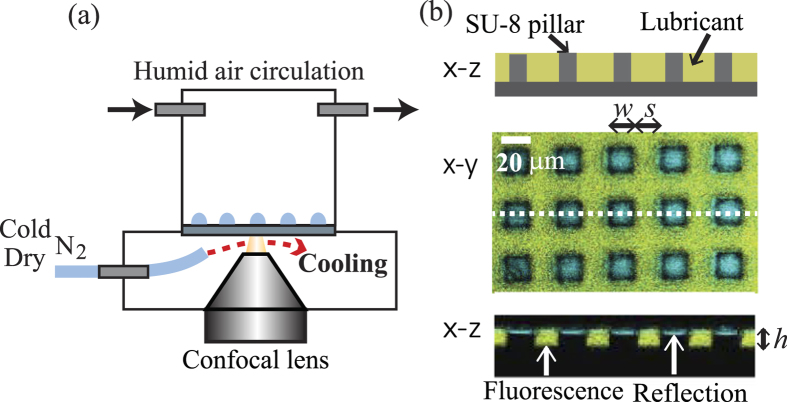
Figure 1.
(a) Schematic representation of the temperature and humidity controlled measurement cell in the confocal microscope. (b) Schematic and confocal images of the LIS. For a confocal image, the x−y and x−z slices are shown. The yellow region corresponds to the ionic liquid. The blue color is the reflection from the interface. The pillars and substrate appear black. The pillar geometry is characterized by width (w), spacing (s) and height (h).

